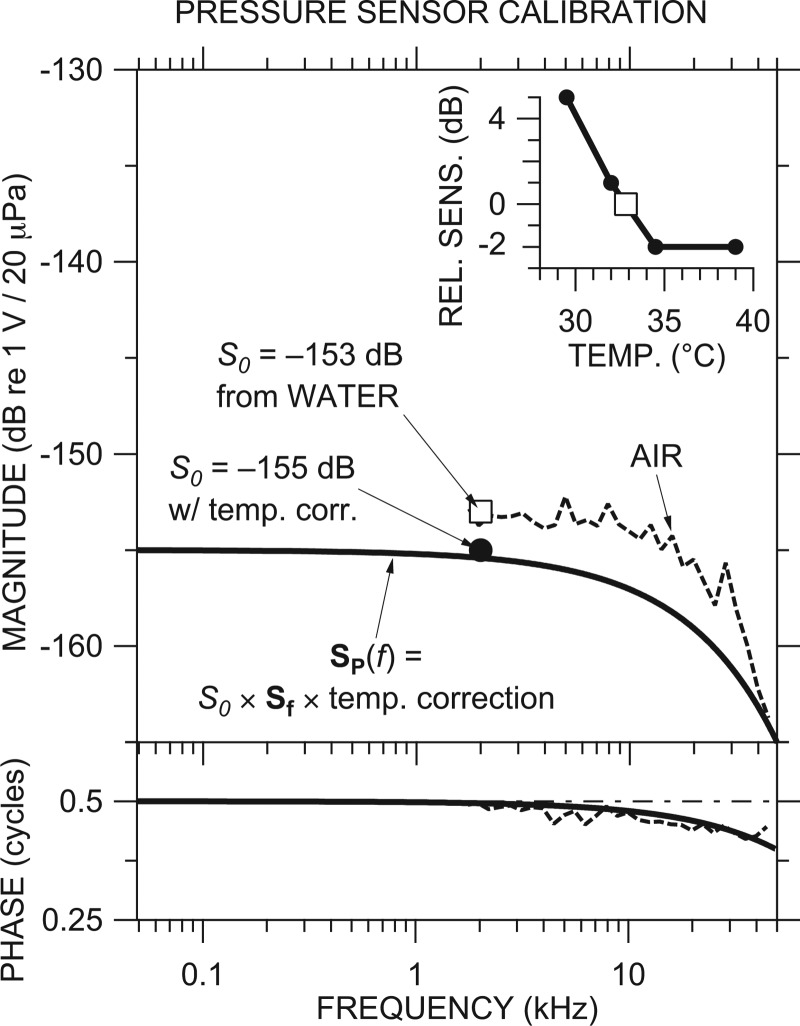
Figure 1.
Example of a pressure sensor calibration. The final calibration SP(f) (thick black line) was constructed from the sensitivity S0 of −153 dB (open square) from a water calibration in a vial evaluated at 2 kHz, high-frequency response Sf and phase accumulation modeled from air calibration (dashed line), and a correction for the temperature difference (inset) between calibration (at 33 °C; open square) and use (2 dB at 37 °C) (filled circle). Top: Magnitude; bottom: Phase.

