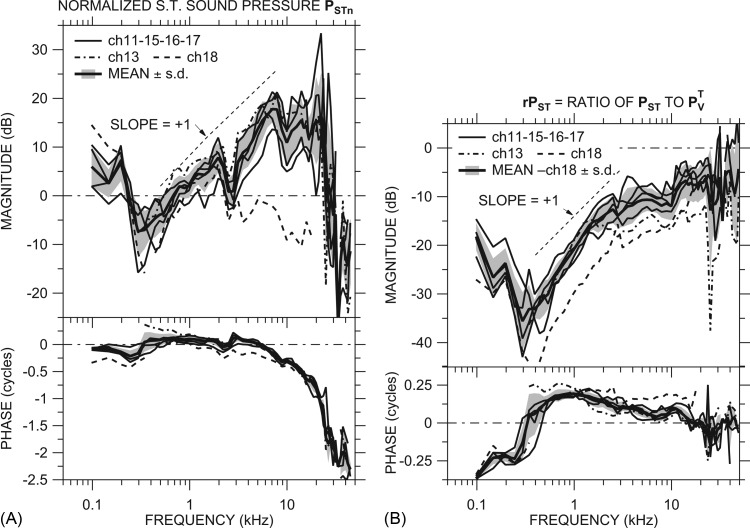
Figure 3.
(A) Scala tympani sound pressure PSTn (normalized by Pnear-TM) in dB in all ears: ch13 (dotted-dashed line), ch18 (dashed line), and others (thin solid lines). Also shown is the mean PSTn of all ears except ch18 (thick solid line) ±1 s.d. (shaded area). (B) Ratio of PST to = rPST in all ears measured. Line codes as in (A). Also shown is the mean rPST of all ears except ch18 (thick solid line) ±1 s.d. (shaded area). Both panels: Top: Magnitude; bottom: Phase; slope of +1 shown by dotted line.

