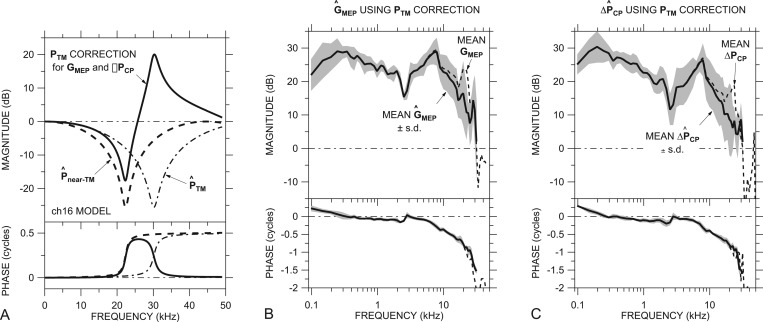
Figure 5.
(A) Correction factor c (solid line) to estimate sound pressure at the TM PTM from measured Pnear-TM in an example ear (ch16), computed as the inverse of the ratio of (dotted-dashed line) to (dashed line; both normalized by sound pressure at the EC termination) in an ear-canal model. (B) Predicted mean ±1 s.d. (thick line and shading) and (C) predicted mean ± 1 s.d. (thick line and shading) computed from PV, PST, and Pnear-TM using a c correction for each ear as in (A). The uncorrected GMEP (Fig. 2) and ΔPCP (Fig. 4) are shown by dashed lines. All panels: Top: Magnitude; bottom: Phase.

