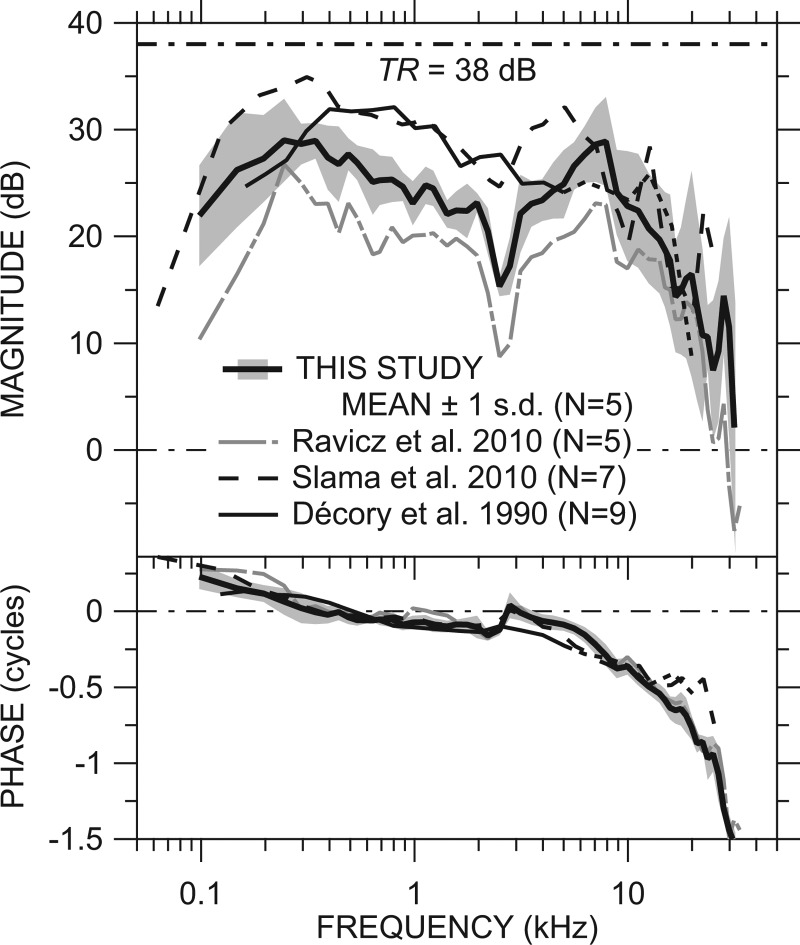
Figure 6.
Comparison of our mean GMEP with ST intact [from Fig. 5B; thick line] ±1 s.d. (shading) to previous measurements of ME gain in chinchilla by Ravicz et al. (2010, Fig. 6; sensor in ST; gray long-dashed-dotted line), Slama et al. (2010, Fig. 8; dashed line), and Décory et al. (1990, Fig. 4; thin black line solid or dotted above 5 kHz, see text) and the anatomical “transformer ratio” TR = 38 dB (dotted-dashed line). The ME was opened widely for all measurements. Top: Magnitude; bottom: Phase.

