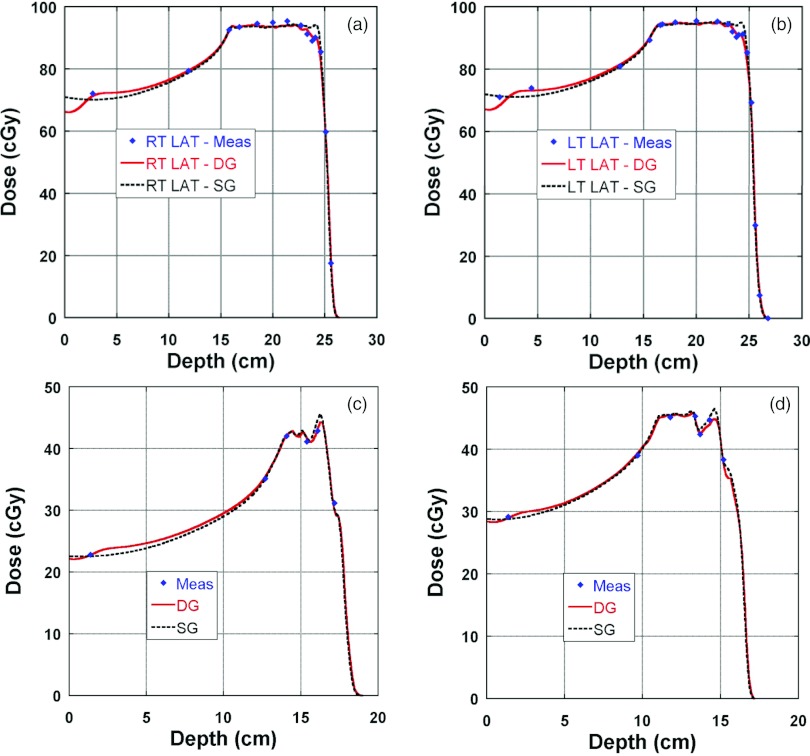
Figure 11.
Clinical examples of comparison of depth doses between measured and calculated by the DG and SG fluence models. Diamonds: measured; solid lines: calculated by the DG fluence model; and dashed lines: calculated by the SG fluence model. (a) and (b) are for a patient with prostate cancer treated with right and left lateral fields. The depth doses were recalculated with the DG fluence model for the original plan which was optimized and calculated with the SG fluence model as the dose model; (c) and (d) are for two of four fields for a pediatric patient with chordoma in the base of skull. The patient plan was optimized and calculated with the DG fluence model and the SG depth doses were recalculated with SG fluence model for the purpose of comparison.

