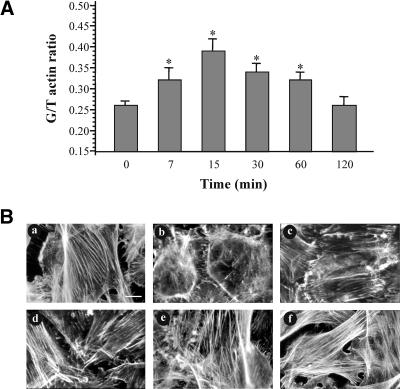
Figure 3.
Actin redistribution and depolymerization in response to TNF-α. (A) Cells were incubated for the indicated times with 10 ng/ml TNF-α and then the monomeric (G) or total (T) actin levels was measured as described in MATERIALS AND METHODS. Data are presented as G/T actin ratio (mean + SEM from five separate experiments; significance level *p < 0.05). (B) Cells were incubated with TNF-α for 7 (b), 15 (c), 30 (d), 60 (e), or 120 (f) min and then the redistribution of filamentous actin was determined with rhodamine-phalloidin staining by immunofluorescence microscopy. (a) Untreated cells. Bar, 20 μm. Similar results were obtained in three independent experiments.

