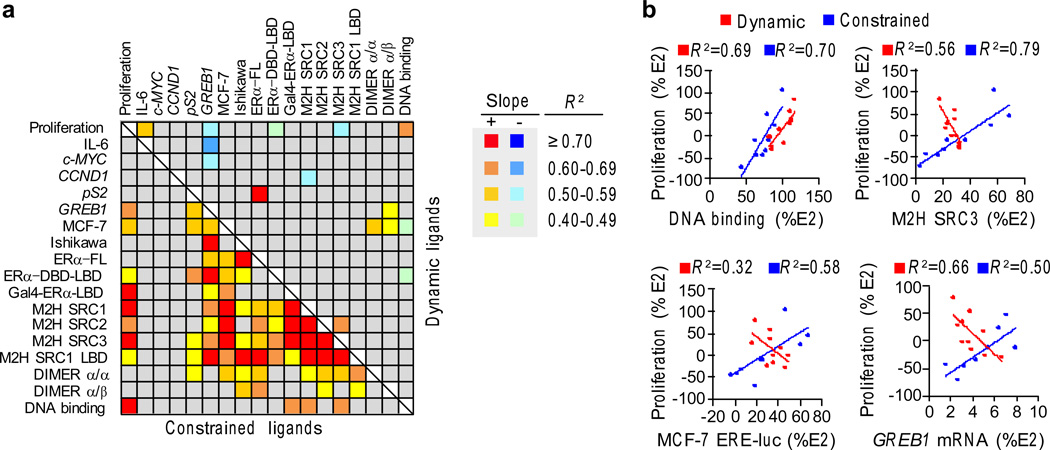
Figure 4. Cellular correlates of ER proliferation.
a) Cross-correlation matrix for R2 between all the bioassays. Linear regression analysis was performed to identify relationships between the assays. The R2 ranges are shown as a heat map. The slope of the regression line indicates whether the associations are positively or negatively correlated with the dynamic-ligand data on the top and the constrained-ligand data on the bottom. (Proliferation – MCF-7 proliferation assay; IL-6 – TNFα induced IL-6 expression measured by AlphaLISA in MCF-7 cells; cMYC, CCND1, and pS2 – mRNA measured in MCF-7 cells; MCF-7 and Ishikawa – ERE-Luciferase driven by endogenous ERα; ERα-FL, ERα-DBD-LBD and GAL4-ERα-LBD – ERE-Luciferase assays in HepG2 cells; M2H SRC1, M2H SRC2 and M2H SRC3 – mammalian 2-hybrid assays with ERα as the bait and with either SRC1, SRC2 or SRC3 as prey; M2H SRC1 LBD – mammalian 2-hybrid assays with ERα-LBD as the bait and with SRC1 as prey; DIMER α/α and α/β – dimerization between ERα homodimers and ERα/β heterodimers measured using BRET assay). All assays are represented as percentage of E2 response, except for IL-6, which is represented as percentage of TNFα stimulated IL-6. The assays are described in detail in Supplementary Table 2 and online methods. The R2 values are shown in Supplementary Figure 10.
b) Data from the dynamic ligands are red, while the data from the constrained ligands are blue for the indicated assays. The linear regression plots are shown with the R2 values.

