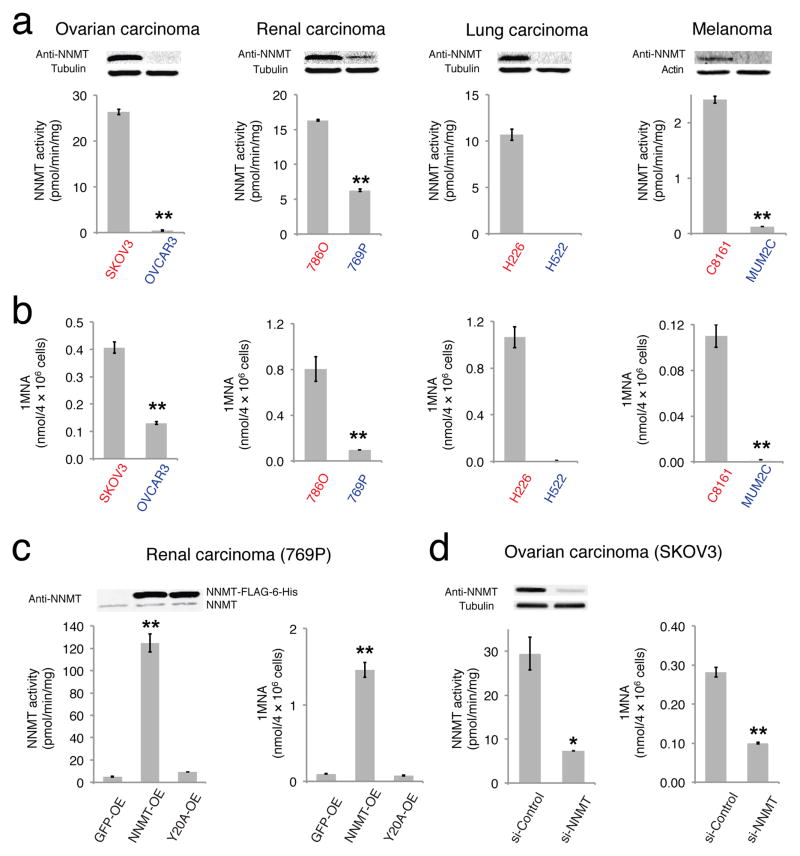
FIGURE 1. NNMT is elevated in aggressive human cancer cells.
(a) NNMT levels and activity are consistently elevated in aggressive human cancer cell lines (red) compared to non-aggressive cancer cell lines (blue), as determined by western blotting with anti-NNMT antibodies (upper panels) and nicotinamide (NA) substrate assays (bar graphs). NNMT activity in H522 cells was below detection limit. (b) Aggressive cancer cells possess higher levels of the NNMT product 1-methylnicotinamide (1MNA). 1MNA levels in H522 cells were below detection limit. (c) Overexpression of NNMT in non-aggressive 769P cells (NNMT-OE) confirmed by WB and NA substrate assay. GFP-OE and Y20A-OE cells correspond to control cancer cell models infected with GFP-vector and a catalytically inactive NNMT mutant (Y20A16), respectively. All exogenous proteins contained FLAG-6-His epitope tag and migrated slower on SDS-PAGE compared to endogenous proteins. NNMT-OE cells also showed elevated levels of 1MNA compared to GFP-OE or NNMT-Y20A cells. (d) SKOV3 cells were transiently transfected with the indicated siRNA constructs. A greater than 75% reduction in NNMT was confirmed by western blotting and activity assay in si-NNMT cells compared to si-Control cells transfected with nonsilencing siRNA that has no homology to any known mammalian gene. si-NNMT cells also showed decreased levels of 1MNA. All data shown as mean ± SEM; for metabolomics experiments N = 3–4/group; for substrate assay N = 2/group; * P < 0.05, ** P < 0.01 for NNMT-OE versus control (GFP-OE and Y20A-OE) groups or for si-NNMT versus si-Control groups. See Supplementary Fig. 13 for full gel images.

