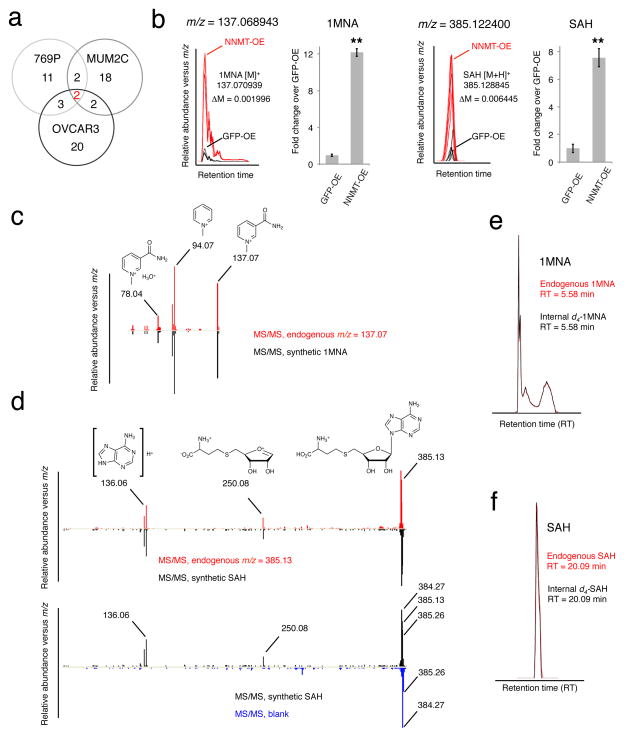
FIGURE 2. Structural assignment of 1MNA and SAH as deregulated metabolites in NNMT-OE cells.
(a) Comparative metabolomics of NNMT-OE and GFP-OE cancer lines. Venn diagram showing the number of metabolites commonly and significantly deregulated in three NNMT-OE cancer lines compared to their respective GFP-OE control cells. Two metabolites were identified as significantly different, based on showing a > 2-fold change in level in NNMT-OE compared to GFP-OE cells with a P -value for this difference of < 0.01. (b–f) These two metabolites were identified as 1MNA and SAH by searching their exact masses (b) against the Human Metabolome Database and comparing their fragmentation patterns (c, d) and LC-migration times (e, f) with synthetic standards. Part b shows bar graphs of quantified values for 1MNA and SAH in a representative pair (769P) of NNMT-OE and GFP-OE cancer cells. Note that for part d, synthetic SAH and endogenous m/z = 385.13 showed identical fragmentation spectra producing 250.08 and 136.06 daughter ions (upper panel). Ions with m/z values of 384.27 and 385.26 observed in SAH fragmentation spectrum are contamination signals as they were also observed in a control (blank) run (bottom panel). (b), data are presented as mean values ± SEM; N = 4 experiments/group; ** P < 0.01 for NNMT-OE versus control GFP-OE group.

