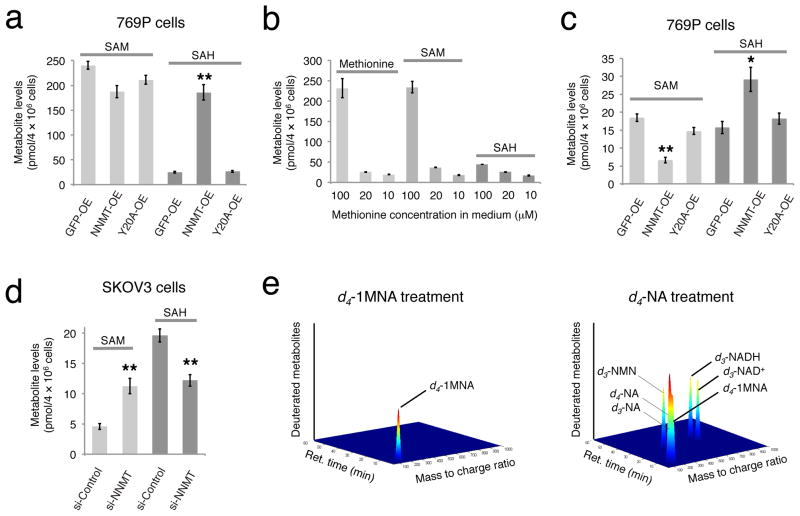
FIGURE 3. NNMT regulates SAM and SAH levels in cancer cells.
(a) Targeted LC-MS with a deuterated internal standard confirmed elevated SAH levels in NNMT-OE cells compared to GFP-OE and Y20A-OE control cells. Data are shown for 769P cells; see Supplementary Fig. 5 for similar data on MUM2C and OVCAR3 cells. (b) Cellular levels of methionine and SAM were much lower in 769P cells cultured for 48 h in 10–20 μM versus 100 μM concentrations of methionine, while SAH levels were less affected. (c) NNMT-OE 769P cells cultured with 10 μM methionine possess significantly lower SAM levels and elevated SAH levels compared to GFP-OE and Y20A-OE cells. (d) si-NNMT cells grown on low (10 μM) methionine exhibit elevated SAM and lower SAH levels compared to si-Control cells. (e) LC-MS profiling of 769P cells treated with d4-labeled 1MNA (d4–1MNA) for 24 h revealed accumulation of d4–1MNA, but no other deuterated metabolites were detected. In contrast, d4-labeled-nicotinamide (d4-NA) was converted by cancer cells into d4–1MNA and several deuterated intermediates in the NAD+ biosynthetic pathway, including NAD+, NADH, and nicotinamide mononucleotide (NMN). For illustration purposes, signal intensities of each metabolite were arbitrarily set to a value of 1; see Supplementary Fig. 9 for actual signal intensity values for each metabolite. For (a–d), data are presented as mean values ± SEM; N = 3–4 experiments/group; * P < 0.05, ** P < 0.01 for NNMT-OE versus control (GFP-OE and Y20A-OE) groups or for si-NNMT versus si-Control groups.

