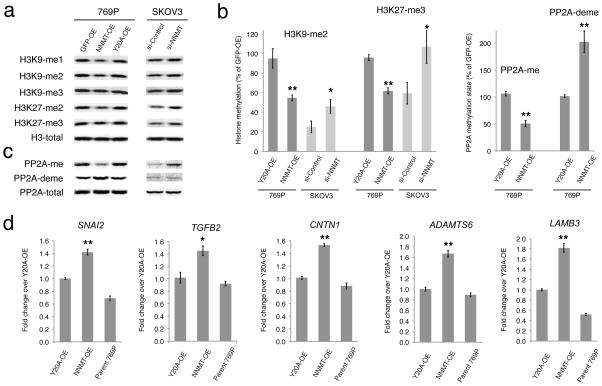
FIGURE 4. NNMT regulates the methylation state of histones and other signaling proteins in cancer cells.
(a, b) NNMT-OE 769P cells show reductions in histone 3 methylation events compared to GFP-OE and Y20A-OE control cells as determined by Western blotting. Conversely, si-NNMT SKOV3 cells show increases in most of these histone methylation events compared to si-Control cells. (b) Bar graphs quantifying representative methylation changes shown in (a) and (c). (c) NNMT-OE 769P cells show reduced levels of PP2A methylation compared to GFP-OE and Y20A-OE control cells as determined by Western blotting. Conversely, si-NNMT SKOV3 cells show increased levels of PP2A methylation compared to si-Control cells. Lane assignment is defined as in (a). (d) Real-time (RT)-PCR analysis showing upregulation of five cancer-related genes in NNMT-OE compared to Y20A-OE or parental 769P cells. Gene changes were normalized to the average of three housekeeping genes, including ACTB, GAPDH and HPRT1. For all studies, cells were cultured in low (10 μM) methionine medium. All data are presented as mean values ± SEM; For (b), N = 4–6 experiments/group. Western blot band intensity was first normalized to total histone 3 levels, followed by normalization of all samples to GFP-OE control group. * P < 0.05, ** P < 0.01 for NNMT-OE versus control Y20A-OE groups, or for si-NNMT versus si-Control groups. For (d), N = 4 experiments/group. * P < 0.05, ** P < 0.01 for NNMT-OE versus control (Y20A-OE and parental 769P cells) groups. See Supplementary Fig. 14 for full gel images.

