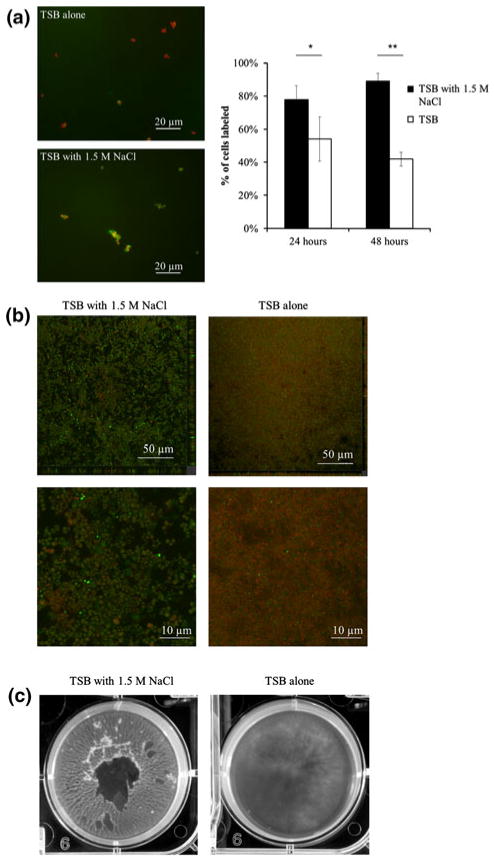
Fig. 4.
Effects of high osmotic pressure conditions on biofilm formation. a Immunofluorescence microscopy of S. epidermidis cell Embp expression at 24 h (anti-rEmb25882 antibodies, green) and counterstained with SYTO9 (red) in TSB alone (Top) or TSB plus 1.5 M NaCl (bottom). Chart quantifies anti-Embp staining in TSB with 1.5 M NaCl (black bars) or TSB alone (white bars) at 24- and 48-h biofilm growth. Error bars standard deviations of the mean. *P <0.01, **P <0.00001. b Confocal micrograph of S. epidermidis biofilm formation in TSB with 1.5 M NaCl (left) versus TSB alone (right) with close ups of depicting cell morphology (below). Staining performed with BacLightLive/Dead stain. c Photograph of S. epidermidis biofilm formation at 48 h in TSB supplemented with 1.5 M NaCl (left) versus TSB alone (right)

