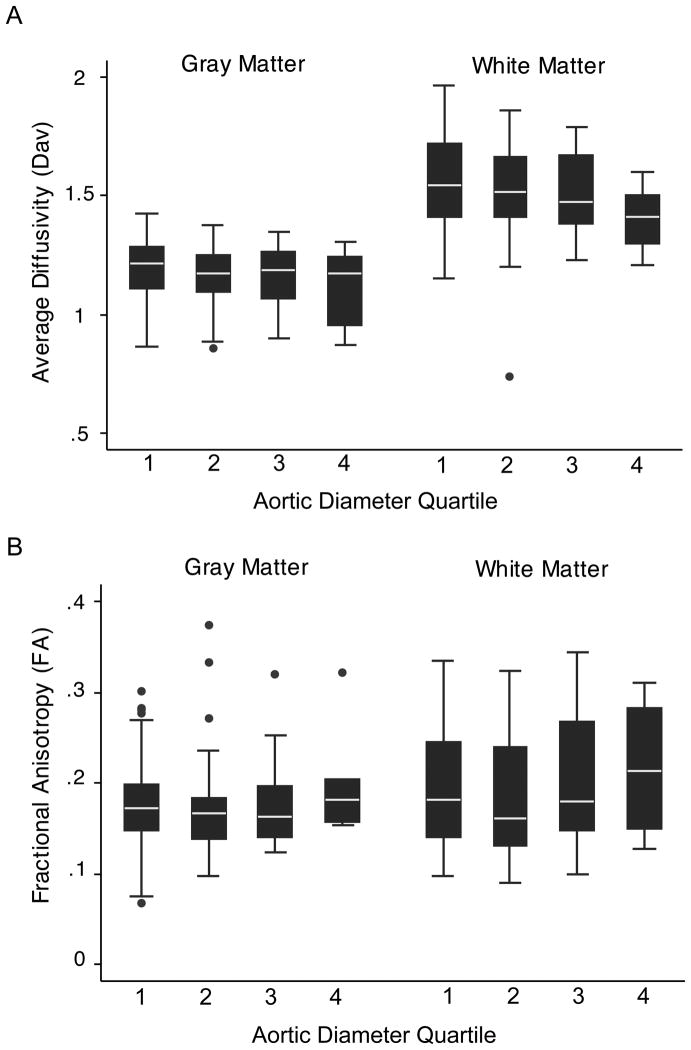
Figure 1.
Box and whisker plots of average diffusivity (Dav) (A) and fractional anisotropy (FA) (B) by arch quartile. Gray (basal ganglia, thalamus, calcarine cortex) and white matter (optic radiations, posterior, perirolandic and frontal white matter) regions of interest are averaged and plotted against quartiles of aortic diameter (1= 0–2.5 mm; 2= 2.6–5 mm; 3= 5.1–7.5 mm; 4= 7.6 – 10 mm). Each plot consists of the median – white line in the middle of the black box, the 25th and 75th percentiles – ends of black box, and the 5th and 95th percentile -- ends of the whiskers. Outliers are indicated by black circles.

