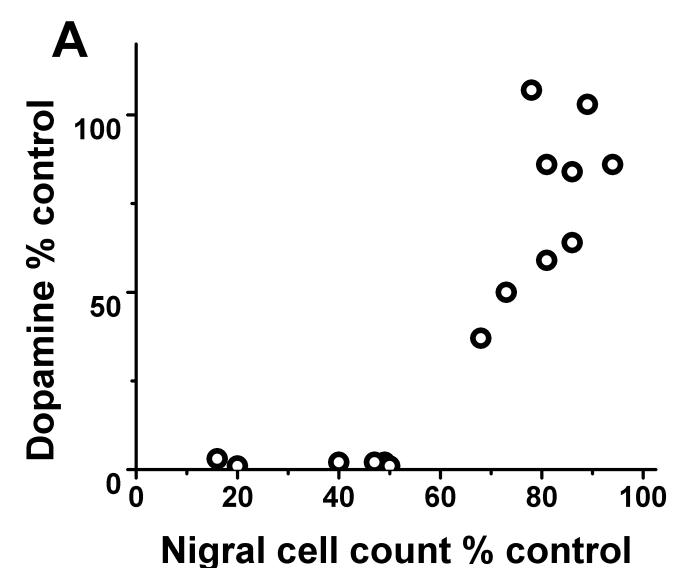
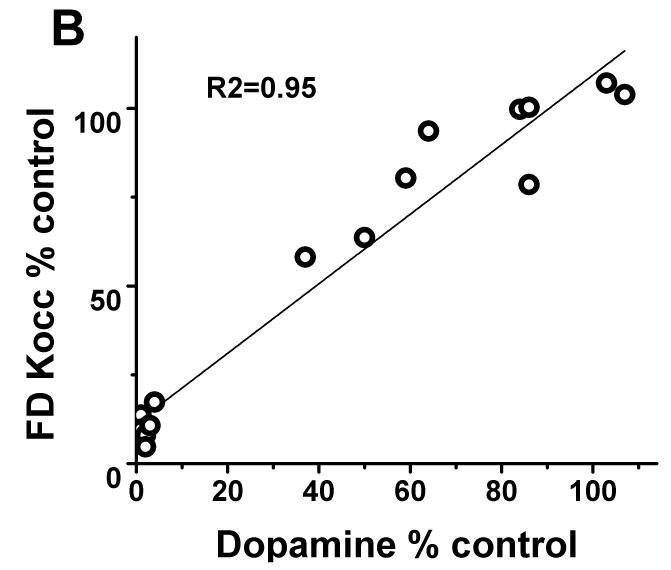
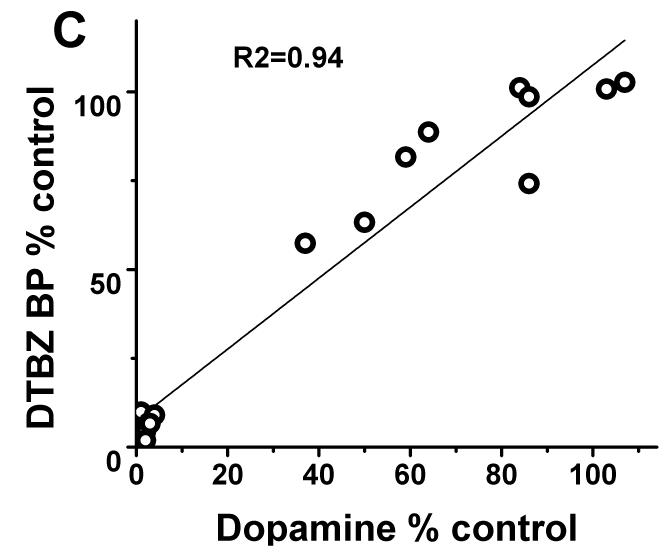
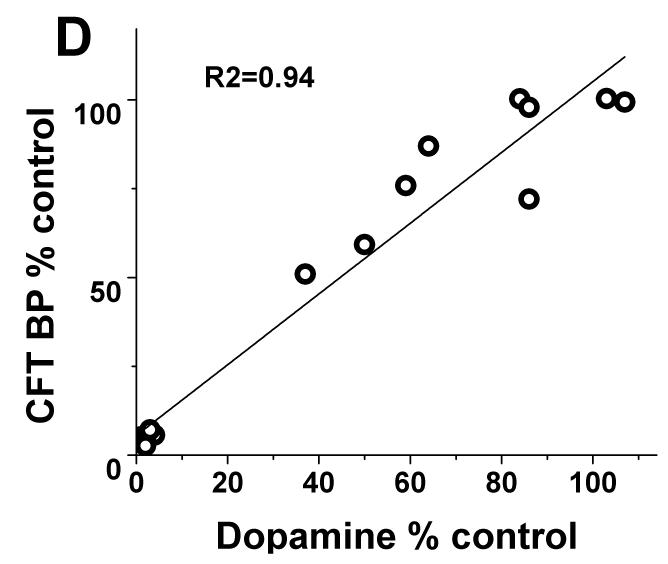
FIGURE 2.
(A) Striatal dopamine measures had flooring effect with > 50% nigral cell loss. (B-D): There was a linear distribution of striatal dopamine (% control side) compared to striatal FD KOCC, DTBZ and CFT BPND (% control side) with or without the clustered data points (Pearson’s correlation: r2= 0.95; r2= 0.94; r2= 0.94 respectively with p<0.001, n=16; r2= 0.84; r2= 0.85; r2= 0.86 respectively with p<0.001, n=10).


