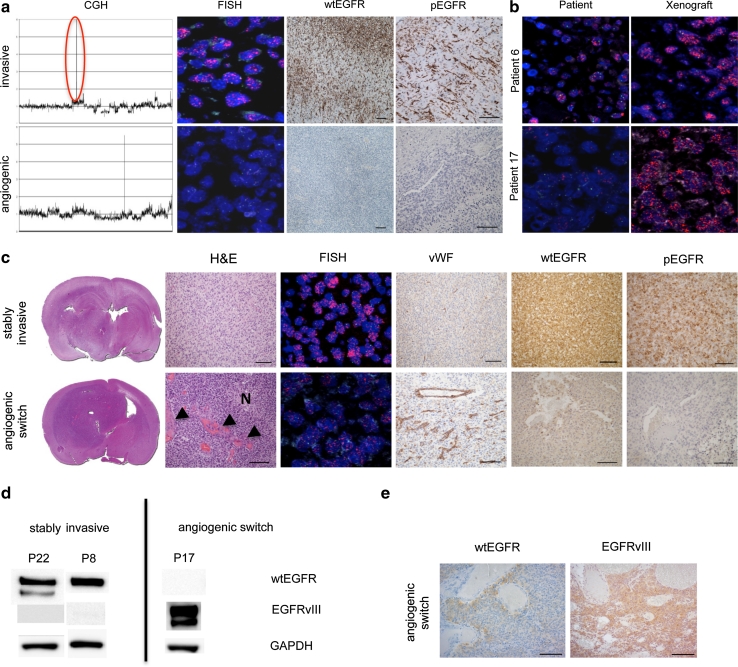
Fig. 2.
EGFR amplification and activation promote non-angiogenic tumor growth in glioblastoma xenografts. a aCGH of invasive (P17) and angiogenic (P13) tumors. Red circle highlights EGFR amplification. FISH with an EGFR/chromosome 7 probe in red and green, respectively and immunohistochemical staining of sections from invasive and angiogenic tumors with antibodies against wtEGFR and phosphorylated EGFR. Amplification, expression and activation of wtEGFR are present only in the invasive phenotype. b FISH with an EGFR/chromosome 7 probe in red and green, respectively (patient/xenograft labels correspond to Table 1). The majority of tumor cells in xenograft tumors show high EGFR amplification. In contrast, tumor cells from patient biopsies show variable amounts of EGFR amplification. c In vivo passaged EGFR-amplified tumor that stays stably invasive (patient 8) shows also stable wtEGFR and pEGFR expression. In contrast, an in vivo passaged EGFR-amplified tumor that switches to angiogenesis (P17) shows downregulation of wtEGFR and pEGFR in the angiogenic center. N depicts a necrotic area and the arrowheads indicate microvascular proliferation. All pictures are taken from the tumor center. Scale bars 100 μm. d wtEGFR and EGFRvIII western blot of stably invasive xenografts and xenografts that switch to angiogenesis (xenograft labels correspond to Table 1). EGFRvIII expression is lost in stably invasive xenografts, while it is upregulated upon the angiogenic switch. e Immunhistochemical staining with antibodies against wtEGFR and EGFRvIII. EGFRvIII is expressed in a xenograft (A3) that switches to angiogenesis, while wtEGFR is downregulated. Scale bars 100 μm

