Fig. 3.
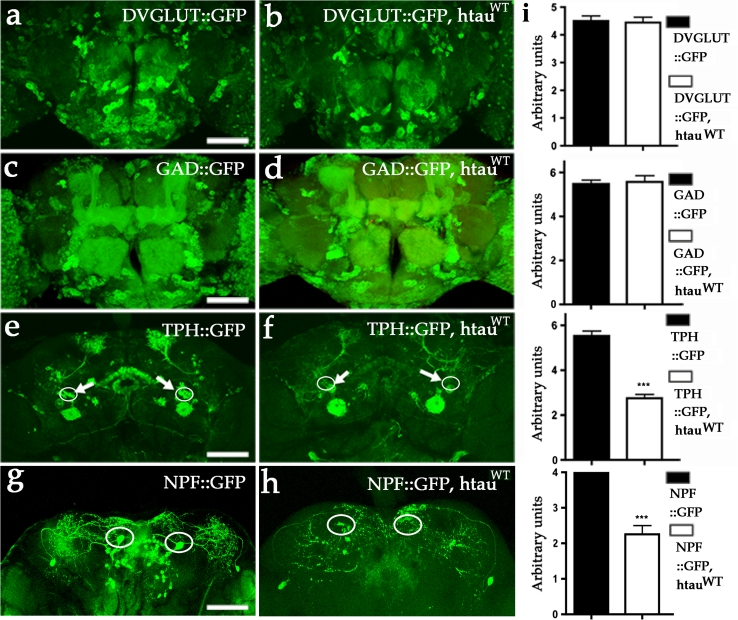
Expression of htauWT fails to manifest neuronal loss in most glutamatergic and GABAergic neurons. a, b Representative confocal images show glutamatergic neurons of 4-week-old fly brains marked with mCD8-GFP. Several thousands of glutamatergic neurons with comparable GFP signals in both control (a, DVGLUT::mCD8-GFP) and htauWT brains (b, DVGLUT::htauWT, mCD8-GFP). c, d Representative confocal images show mCD8-GFP-marked GABAergic neurons in 6-week-old fly brain. Comparable GFP signals can be detected in both control (c GAD::mCD8-GFP) and htauWT brains (d GAD::htauWT, mCD8-GFP). e Representative confocal image shows a group of putative serotonergic neurons (TPH996::mCD8-GFP) projecting to central complex (arrows) at 4 weeks of age. f Representative confocal image shows the absence of GFP signals in neurons projecting to central complex in age-matched brain expressing htauWT (TPH996::htauWT, mCD8-GFP). g Representative confocal image shows two pairs of putative NPF neurons (NPF::mCD8-GFP) projecting to parietal central brains in control (f). In contrast, the GFP signals in a pair of NPF neurons that are located in the anterior region are absent in htauWT-expressing brains (NPF::htauWT, mCD8-GFP) at 4 weeks of age. Scale bar 100 μm. i Quantitative analyses show no significant differences between control (black bars) and htauWT (white bars) brains in DVGLUT, and GAD groups (unpaired t test, P = 0.54 for a and b; P = 0.60 for c and d, n = 4). In TPH and NPF groups, both the cell measurements (circles) between controls and htauWT are different (unpaired t test, ***P < 0.0001 for both e and f, and for g and h, n = 4)

