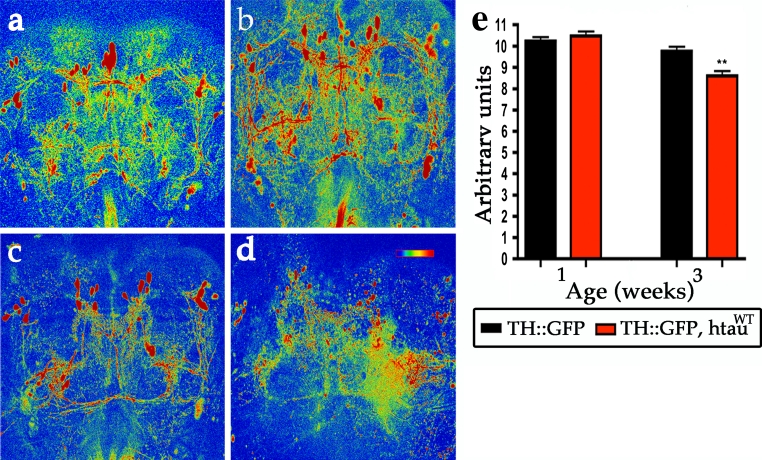
Fig. 7.
Expression of htauWT causes age-dependent loss of G-CaMP activities. G-CaMP signal reveals Ca2+ activity in control DA neurons (TH::G-CaMP) from 1-week-old (a) and 3-week-old (c) flies. Expression of htauWT shows comparable G-CaMP signals compared to control group at 1 week (b), but the signals are reduced 10 % at 3 weeks (d). The G-CaMP activities are represented by thermal color from the higher (red) to lower intensity (blue). Scale bar 100 μm. e Quantitative analysis shows G-CaMP activities in control brains (TH::G-CaMP, black bars) and in htauWT brains (TH::G-CaMP, htauWT, red bars) at indicated ages. Values shown represent Mean ± SEM (unpaired t test; **P < 0.001)

