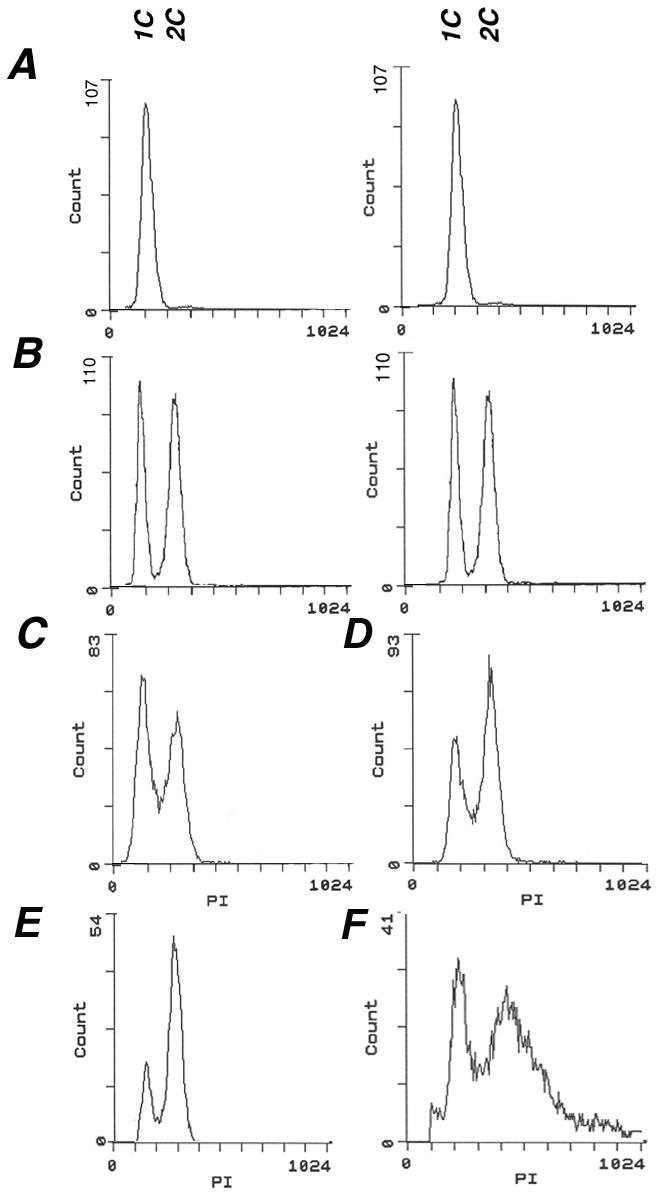
Figure 4.

Cell cycle distribution of cells isolated by elutriation is normal. For flow cytometry analysis, cells were fixed, stained with propidium iodide, and analyzed. Wild-type cells isolated from a stationary phase (A) and from a log phase culture (B) were used as a reference. The DNA content of young and old dna2-1 cells (C and E) and young and old wild-type cells (D and F) isolated by elutriation was analyzed. The x-axis indicates the DNA content (1C and 2C) and the y-axis indicates the cell number.
