Fig. 2.
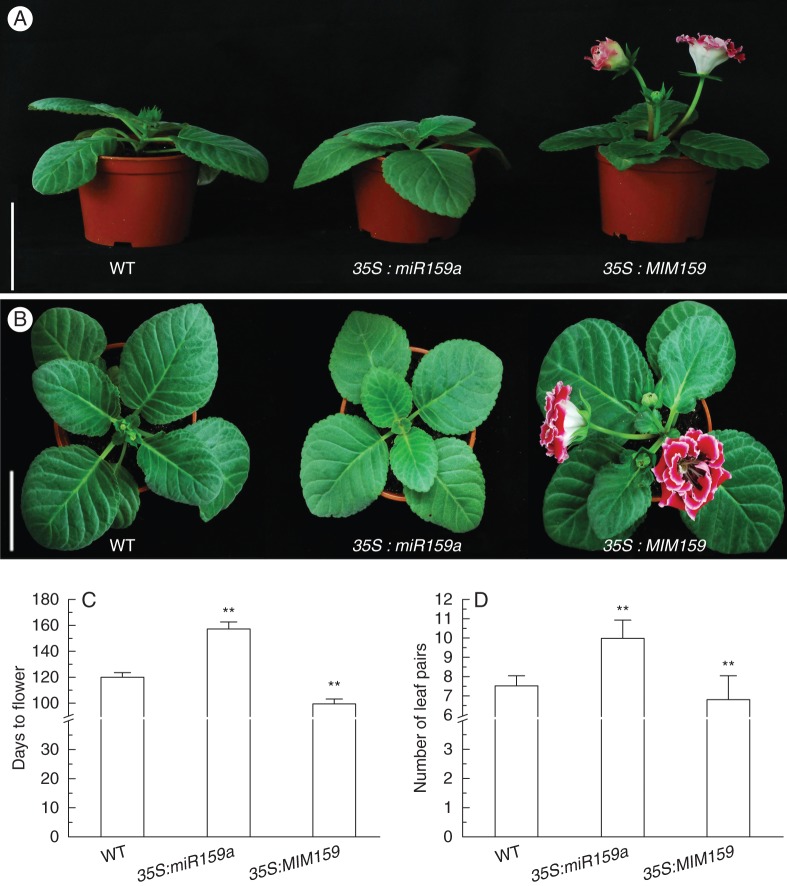
Flowering time alterations in transgenic gloxinias under short-day conditions. (A) Side view of wild-type (WT), 35S:miR159a and 35S:MIM159 transgenic plants. Scale bar = 10 cm. (B) Top view of WT, 35S:miR159a and 35S:MIM159 transgenic plants. Scale bar = 8 cm. All lines in (A, B) are 135 d old after transplantation to pots. (C) Days to flowering after regeneration. (D) Number of leaf pairs at flowering. Data represent means ± s.d. (n > 20). Double asterisks indicate a significant (ANOVA, P < 0·01) difference between transgenic lines and the wild type.

