
Fig. 3.
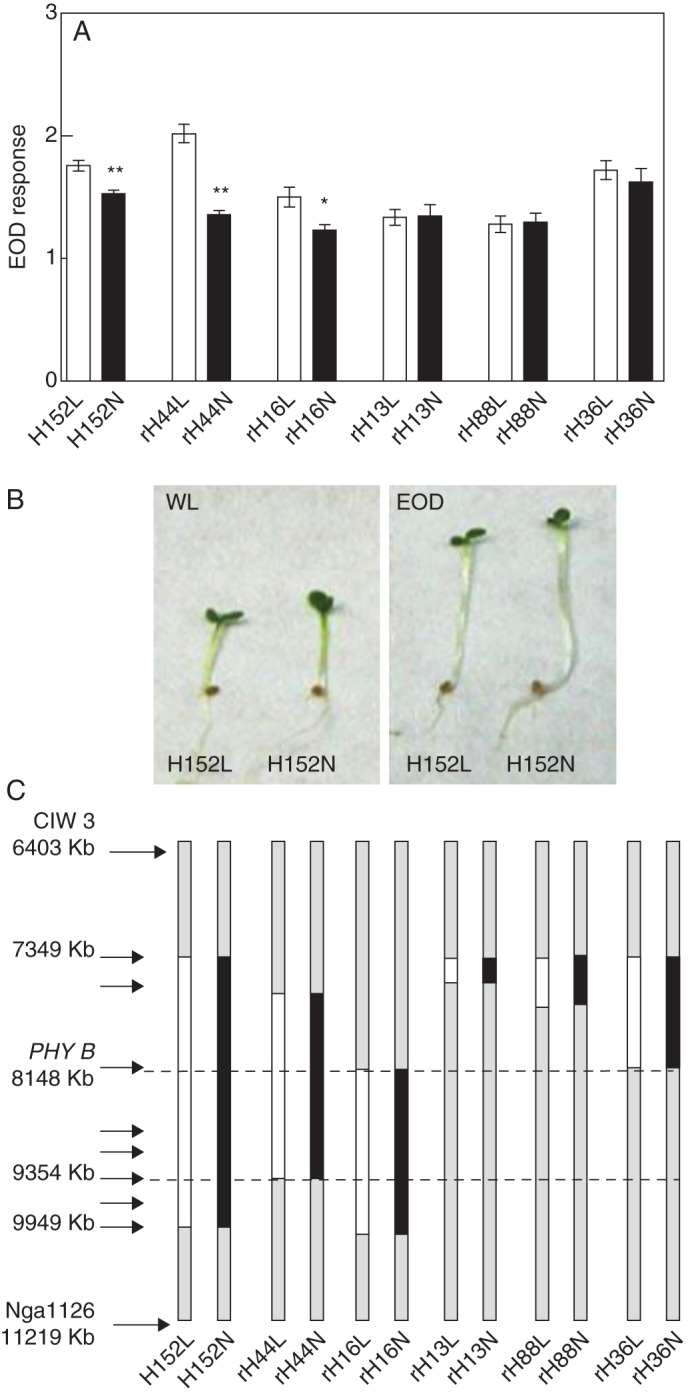
EODRATIO1 is confirmed to an interval of 1·2 Mb on chromosome 2. (A) Hypocotyl length for HIF and rHIF obtained from RIL152 polymorphic at the PSL5 marker. Each bar represents mean ± s.e.m. Significant differences between means were identified by Student's t-test and are indicated: *P < 0·05 and **P < 0·001. (B) Photographs of HIF152 grown under WL or EOD. (C) Diagram of the segregation area for HIF152 and rHIF152 lines on chromosome 2. The segregation area for each line is shown as heterozygous (Ler = white and No-0 = black) or homozygous (grey). Marker positions are indicated by arrows.