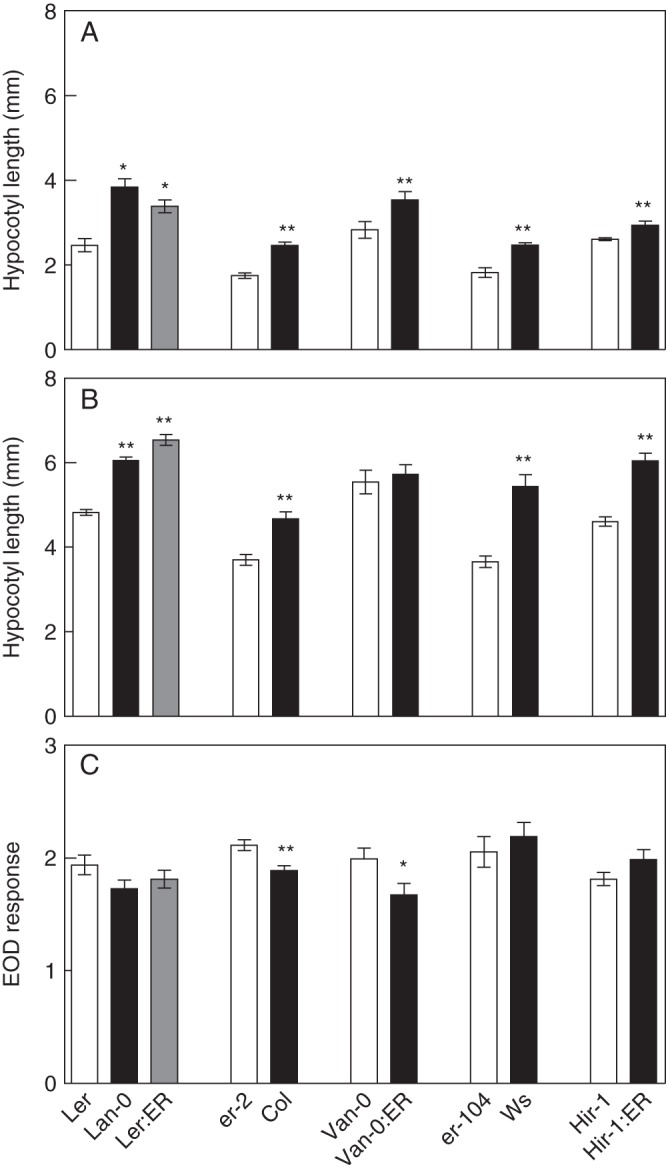
Fig. 6.

ERECTA effects on shade-avoidance responses depend on the genetic background. Hypocotyl length in WL (A), EOD (B) and EOD response (C). Each bar represents mean ± s.e.m. Significant differences between means were identified by Student's t-test and are indicated: *P < 0·05 and **P < 0·001.
