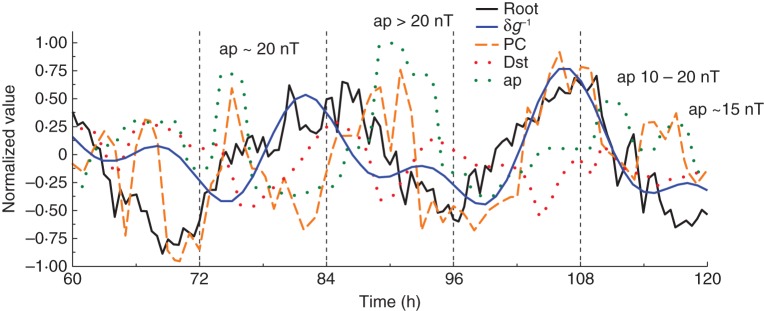
Fig. 4.

A portion of the normalized graph of Fig. 1B. Root elongation rate variation δR (black line) displayed disturbances simultaneous with temporarily elevated values of the ap and PC indices (green and orange lines, respectively). Also shown is the corresponding portion of the δg profile (blue line).
