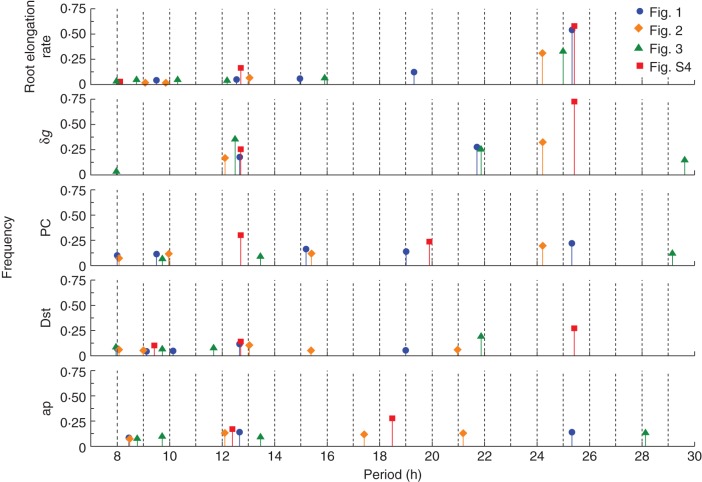
Fig. 8.
Summary bar chart of periodicities (h) and their relative frequencies, derived by FFT analysis, for root elongation rate and the four geophysical parameter values. Results are from each of expts 1–3 (Table 1) and have been depicted in Figs 1–3 and in Supplementary Data Fig. S4.

