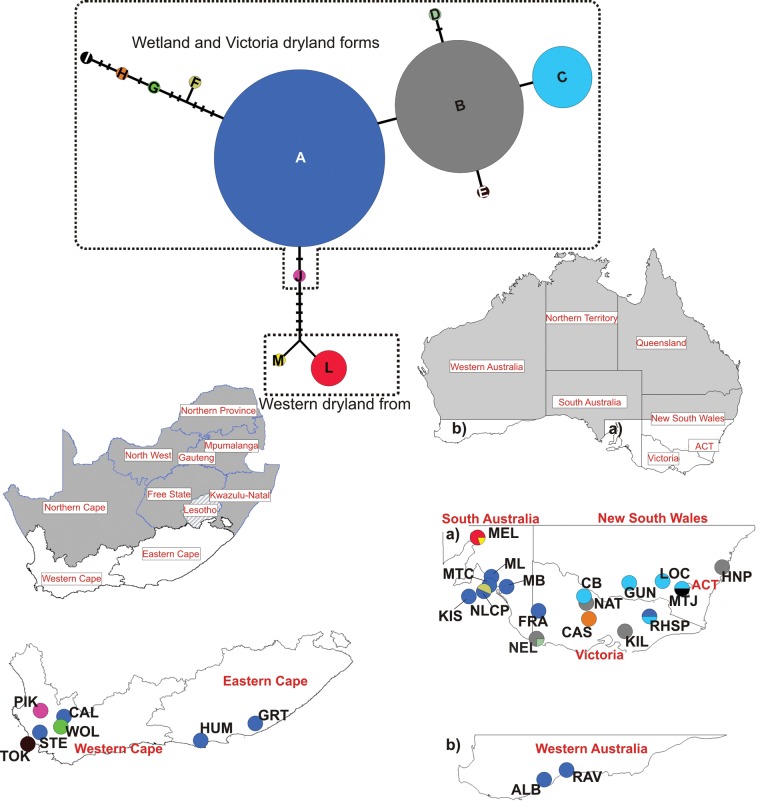
Fig. 2.
Haplotype network of Acacia pycnantha (based on the rpl32-trnL(UAG) region) and geographical distribution of haplotypes in the native south-eastern Australia and invasive South Africa and western Australian ranges. Each unique haplotype is represented by a coloured circle and the size of the circle is proportional to the number of individuals possessing that haplotype. Pie charts represent the proportion and distribution of haplotypes across native (South Australia and New South Wales) and invasive (Western Australia and South Africa) ranges.

