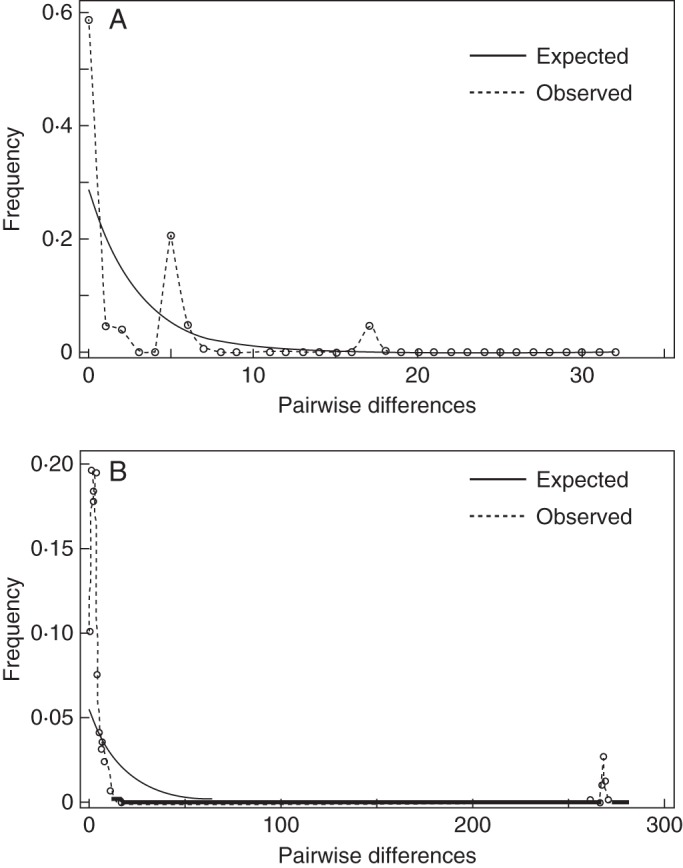
Fig. 4.

Mismatch distributions for DNA sequence data of the plastid (A) and nuclear (B) genomes for Acacia pycnantha in Australia (native range). The solid line represents the expected mismatch distribution of a constant-size population and the dotted line represents the observed mismatch distribution based on A. pycnantha DNA sequence data.
