
Fig. 5.
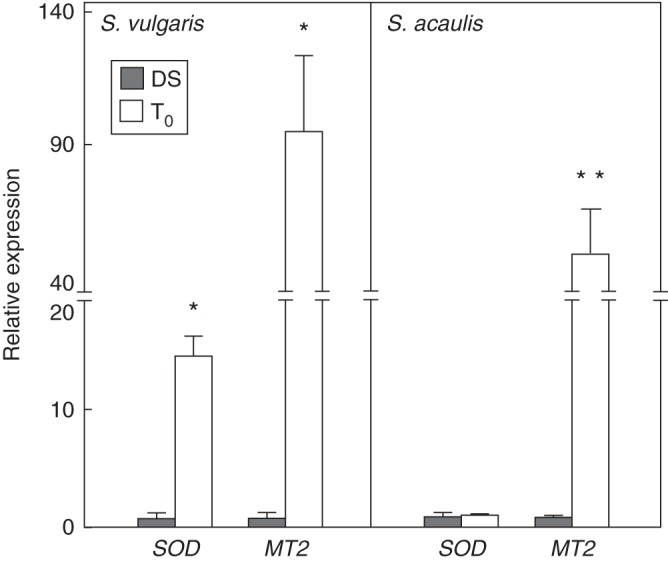
Expression profiles of the SOD and MT genes in Silene seeds were evaluated by QRT-PCR. Values are expressed as means ± s.d. of three independent experiments. Statistical significance: *P < 0·05; **P < 0·01; ***P < 0·001, compared with S. acaulis. DS, dry seeds; T0, rehydrated seeds.