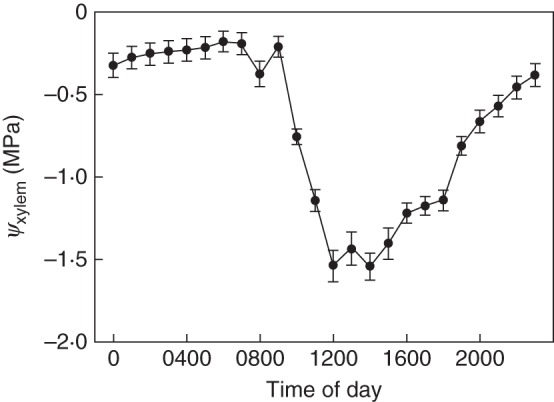
Fig. 3.

Daily course of ψxylem within the stem of the A. macrophylla individual. The data were collected over the whole study period that comprised the vegetation periods 2010 and 2011. The mean values are plotted against hour of the day, with the error bars representing the 95 % confidence interval.
