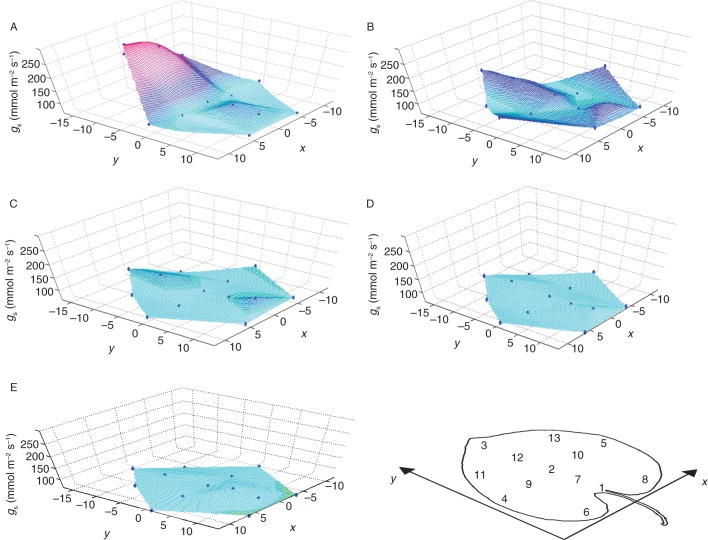
Fig. 5.
Spatial representation of gs of the various considered leaf zones at different times of the day over the study period. The points in the graphs indicate the leaf zones: an image showing the orientation of the graphs and the position markers with respect to the leaf is included. The graphs were generated by calculating the mean gs within a certain time of day at the various zones, and then interpolating gs at the zonal values with the Interpolation Tool of ‘MatLab’ for the entire lamina. The spatial co-ordinates of the x- and y-axis are relative co-ordinates to allow for showing the defined leaf zones. For example, (0,0) denotes the leaf centre, (0, –15) the uppermost point at the leaf tip, and (0, 15) the insertion point of the petiole. (A) ‘Early morning’ (EM), 0500–0800 h. (B) ‘Morning’ (M), from after 0800 h to1100 h. (C) ‘Noon’ (N), from after 1100 h to 1400 h. (D) ‘Early afternoon’ (EA), from after 1400 h to 1600 h. (E) ‘Afternoon’ (A), from after 1600 h to 1900 h.

