Fig. 7.

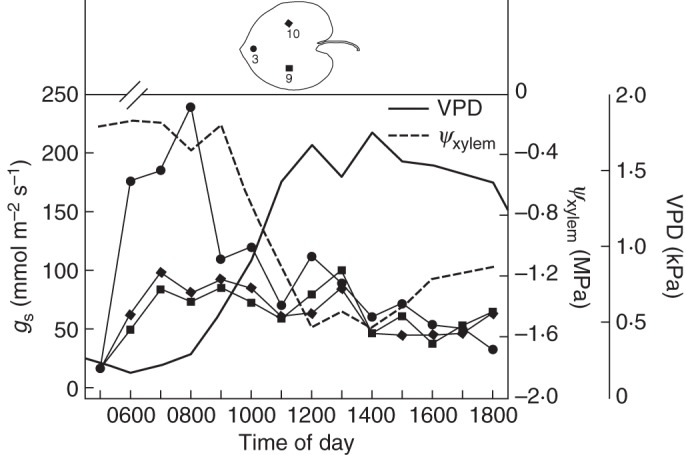
Course of mean hourly daily VPD and ψxylem of the stem, plotted together with mean hourly gs at the leaf zones 3, 9 and 10, as indicated in the inset illustration.

Course of mean hourly daily VPD and ψxylem of the stem, plotted together with mean hourly gs at the leaf zones 3, 9 and 10, as indicated in the inset illustration.