Figure 3.

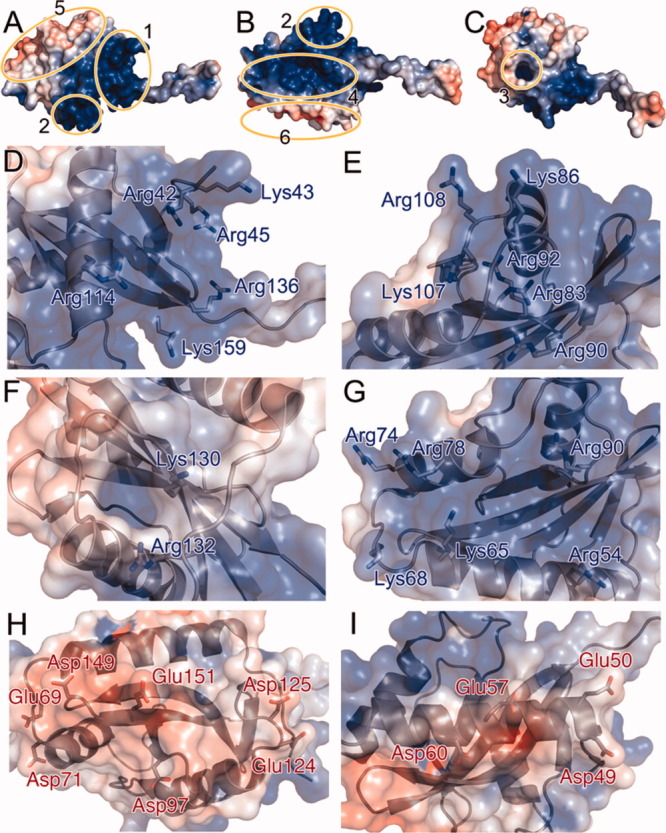
The surface charge distribution of VpCpxA-peri. (A-C) The charge of VpCpxA-peri is calculated within a range of −5 kT (red) to +5 kT (blue) and displayed on the surface diagram of VpCpxA-peri. The basic juxtamembrane region, the basic bulge, the basic hole, the basic side, the large acidic surface, and the small acidic surface are depicted with numbers 1–6, respectively. The side chains of residues constituting each basic or acidic region are drawn as a stick diagram: (D) the basic juxtamembrane region, (E) the basic bulge, (F) the basic hole, (G) the basic side, (H) the large acidic surface, and (I) the small acidic surface.
