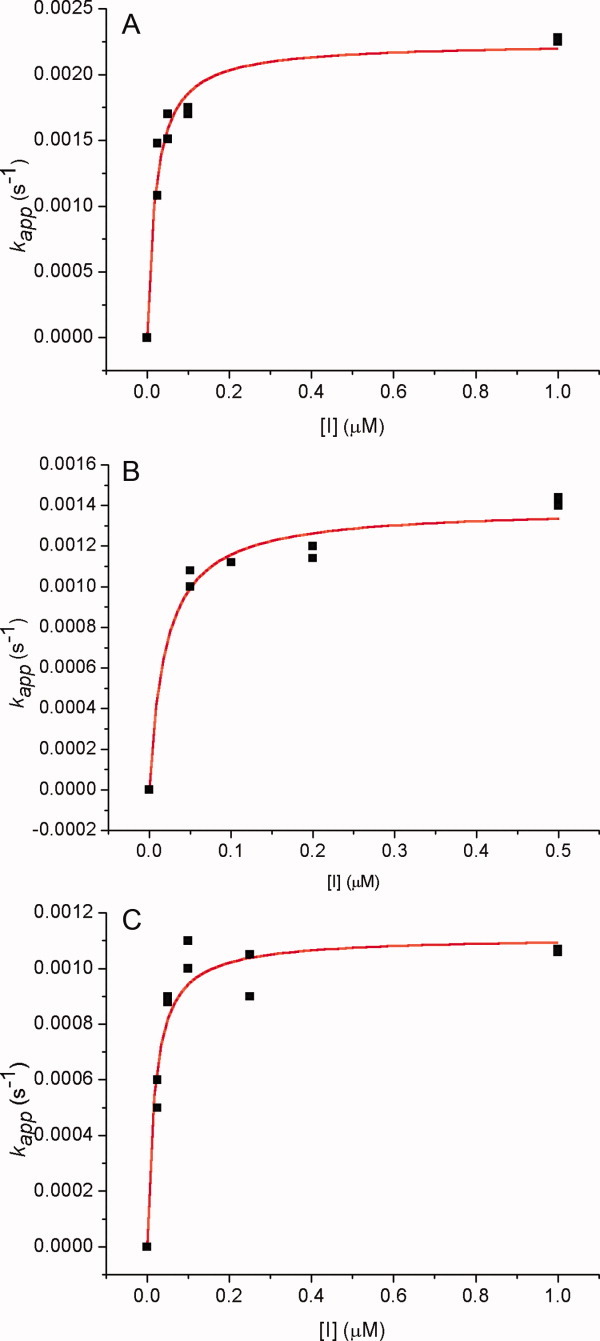
Figure 6.

Nonlinear least-squares curve fittings of kapp versus inhibitor concentration ([I]) plots against Eq. (2) for the pseudo-substrate inhibition12–21 of CEase by (A) 1,3,5-tri-N-n-octylcarbamylphloroglucinol (1), (B) 3,5-di-N-n-hexylcarbamyl- oxyphenol (7), and (C) 5-N-n-heptylcarbamyloxyresorcinol (10). For (A), k2 = 0.0027 ± 0.0001 s−1 and Ki = 15 ± 3 nM (R2= 0.965). For (B), k2 = 0.0016 ± 0.0002 s−1 and Ki = 110 ± 40 nM (R2 = 0.913). For C, k2 = 0.0018 ± 0.0002 s−1 and Ki = 60 ± 20 nM (R2 = 0.926). [Color figure can be viewed in the online issue, which is available at wileyonlinelibrary.com.]
