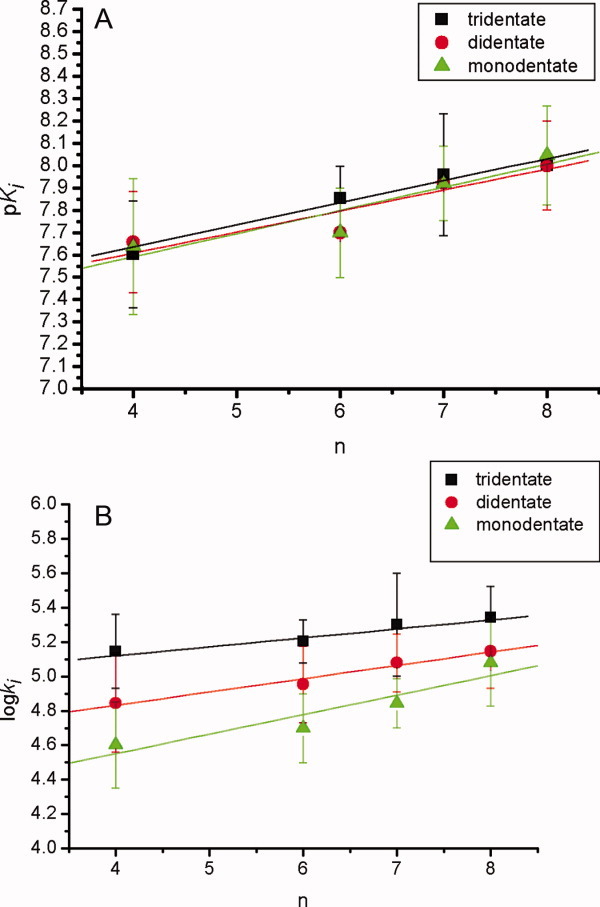
Figure 8.

The (A) pKi and (B) log ki values versus carbamyl carbon numbers (n) of inhibitors 1–12 for the pseudo-substrate inhibition of CEase. In (A), linear correlations between the pKi and n values are observed (pKi = 7.24 ± 0.09 + (0.10 ± 0.01)n and R = 0.979 for tridentate inhibitors 1–4; pKi = 7.2 ± 0.2 + (0.10 ± 0.03)n and R = 0.933 for bidentate inhibitors 5–8; pKi = 7.2 ± 0.2 + (0.09 ± 0.32)n and R = 0.916 for monodentate inhibitors 9–12). In (B), linear correlations between the log ki and n values are observed (log ki = 4.91 ± 0.07 + (0.05 ± 0.01)n and R = 0.957 for tridentate inhibitors 1–4; log ki = 4.52 ± 0.06 + (0.077 ± 0.009)n and R = 0.986 for bidentate inhibitors 5–8; log ki = 4.1 ± 0.2 + (0.11 ± 0.03)n and R = 0.934 for monodentate inhibitors 9–12). [Color figure can be viewed in the online issue, which is available at wileyonlinelibrary.com.]
