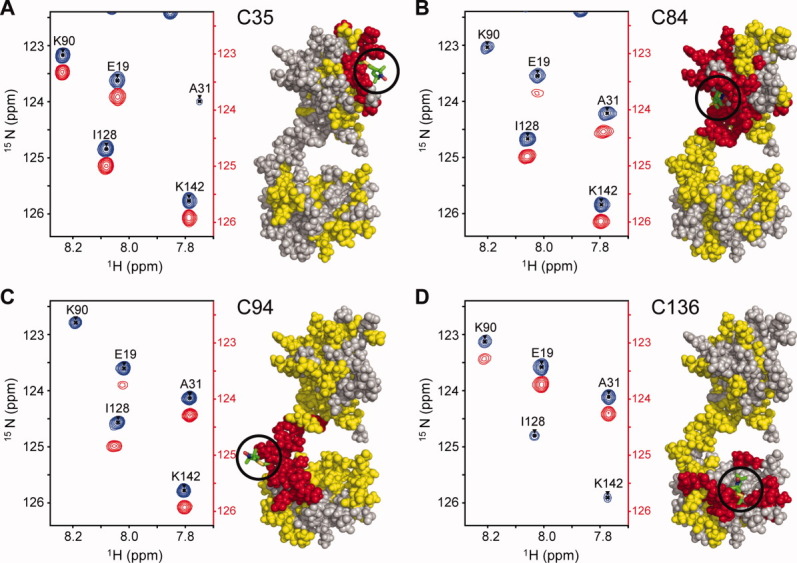
Figure 2.

Strong peak broadening due to the PRE effect was observed in the vicinity of each spin label. A representative section of the paramagnetic (red) and diamagnetic (blue) 15N-HSQC spectrum of each spin-labeled cTnC construct; (A) TnC C35, (B) TnC C84, (C) TnC C94, (D) TnC C136. The superimposed paramagnetic spectrum is offset by 0.30 ppm in the 15N dimension for clarity. The spin label location is shown on the structures to the right of each spectrum (stick representation, green) and residues affected by the spin label are coloured onto cTnC accordingly, where residues broadened beyond detection are in red (<10 Å), residues with significant detectable PREs in yellow (<25 Å) and residues to which no significant PRE was assigned are coloured grey. An interactive view is available in the electronic version of the article.
