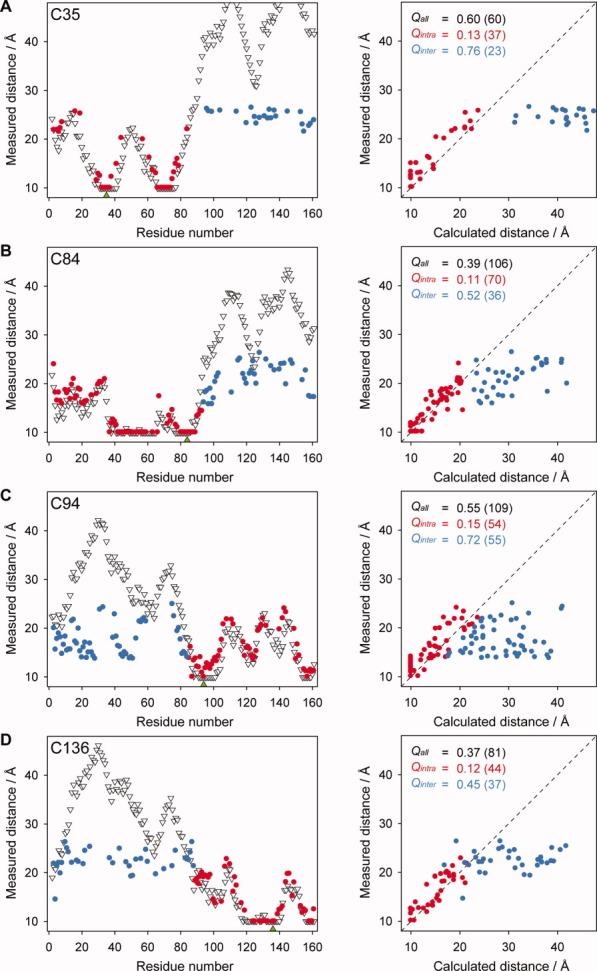
Figure 3.

Measured PRE distances were compared with distances calculated from the coordinates of the cTnC structure 1AJ4.18 Left: The distance plots show the distance measured between the spin label and the amide group of each residue in cTnC, where intra- and interdomain measured distances are colored red and blue, respectively. The distances calculated from the coordinates of the energy minimized solution structure 1AJ4 are also shown (white triangles). The location of the spin label is indicated by a green triangle on the x-axis. For the N-domain spin label sites, (A) TnC C35 and (B) TnC C84, the intradomain distances are those measured within the N-domain. For the C-domain label sites, (C) TnC C94 and (D) TnC C136, the intradomain distances are those measured within the C-domain. Right:Q-factors were used to report the correlation between our measured distances and those calculated from 1AJ4. The Q-factors calculated for each mutant are also indicated where Qall represents all measured distances (both red and blue points) and Qintra and Qinter, represent the intradomain and interdomain distances, respectively. The number of distances contributing to each set is given in brackets. Residues broadened beyond detection in the paramagnetic spectrum and all calculated distances <10 Å are plotted as 10 Å.
