
Figure 1.
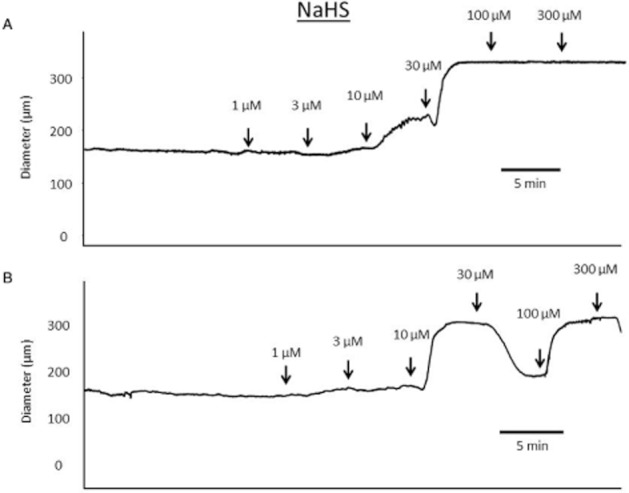
Sample traces showing cumulative concentration–response curves to NaHS (added at 5 min intervals) in rat mesenteric small arteries pressurized to 90 mmHg. U46619 was used to pre-constrict vessels by 40–60% of original vessel diameter and then a concentration–response curve was generated. (A) An example of NaHS producing a concentration-dependent vasodilatation that was maintained over the time course of constructing the concentration–response curve. (B) An example of a complex response to NaHS, with an initial vasodilatation that was not maintained returning towards baseline, before a further vasodilatation was produced by high concentrations of NaHS.