
Figure 3.
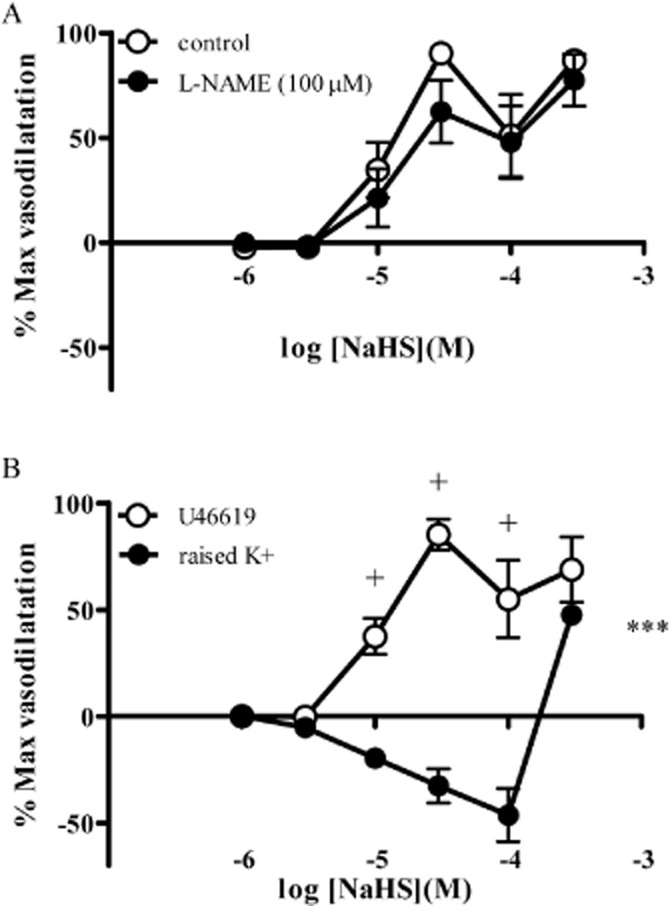
Responses to NaHS in the absence and presence of L-NAME (100 μM) (A) and after inducing tone using raised extracellular potassium (B). Each point represents the mean ± SEM (n = 7). A significant difference between the curves is indicated by ***P < 0.001 (two-way anova), with + representing a significant difference between individual concentrations (Bonferroni's post hoc test).