Figure 2.

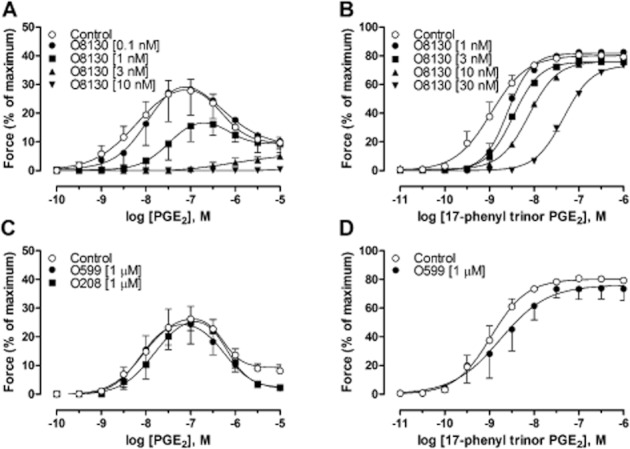
(A) Concentration–response curves to PGE2 in GPT in the presence of the selective EP1 receptor antagonist ONO-8130 (O8130) at different concentrations. (B) Contraction induced by cumulative concentrations to 17-phenyl trinor PGE2 in guinea pig tracheal segments in the presence of ONO-8130 (O8130) at different concentrations (1–30 nM). Schild plot analysis yielding a pA2 value of 8.9 with a slope of 1.0. (C) Concentration–response curves to PGE2 in GPT in the presence or absence of the selective EP3 receptor antagonist ONO-AE5-599 (O599), or selective EP4 receptor antagonist ONO-AE3-208 (O208). (D) Contraction induced by cumulative concentrations to 17-phenyl trinor PGE2 in the presence or absence of ONO-AE5-599 (O599). The contraction of each segment in all experiments was calculated as percentage of maximal contraction (histamine (1 mM), acetylcholine (1 mM) and KCl (60 mM)) in relation to maximal relaxation (theophylline (1 mM) or a combination of papaverine (0.1 mM) and sodium nitroprusside (0.1 mM)). All experiments were performed in the presence of 3 μM indomethacin (3 μM). Data represent mean ± SEM (n = 4–11).
