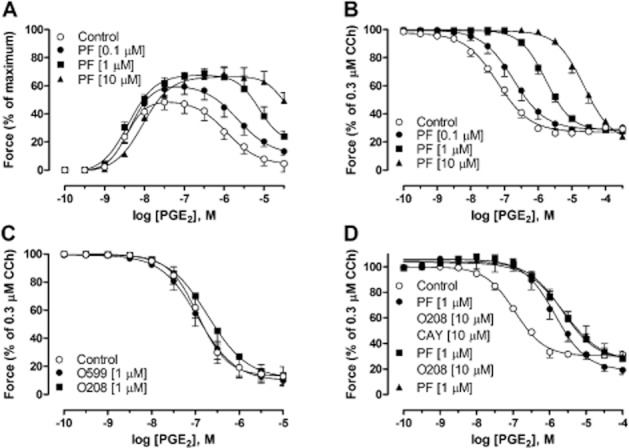
Figure 3.

Concentration–response curves to PGE2 in GPT. (A) In the presence of the selective EP2 receptor antagonist PF-04418948 (PF) at different concentrations. (B) In segments pre-contracted with 0.3 μM carbachol (CCh) in the presence of ONO-8130 (100 nM) and SQ-29 548 (1 μM) and after treatment with PF-04418948 (PF) at different concentrations (0.1–10 μM). (C) In segments pre-contracted with 0.3 μM CCh after treatment with the selective EP3 receptor antagonist ONO-AE5-599 (O599) or the selective EP4 receptor antagonist ONO-AE3-208 (O208). (D) In segments pre-contracted with CCh after treatment with PF-04418948 (PF) together with the EP4 receptor antagonist ONO-AE3-208 (O208) and selective IP receptor antagonist CAY 10441 (CAY), either alone or in combination. The contraction of each segment in all experiments was calculated as percentage of maximal contraction (histamine (1 mM), acetylcholine (1 mM) and KCl (60 mM)) or 0.3 μM carbachol in relation to maximal relaxation [theophylline (1 mM) or a combination of papaverine (0.1 mM) and sodium nitroprusside (0.1 mM)]. All experiments were performed in the presence of indomethacin (3 μM). Data represent mean ± SEM (n = 4–6).
