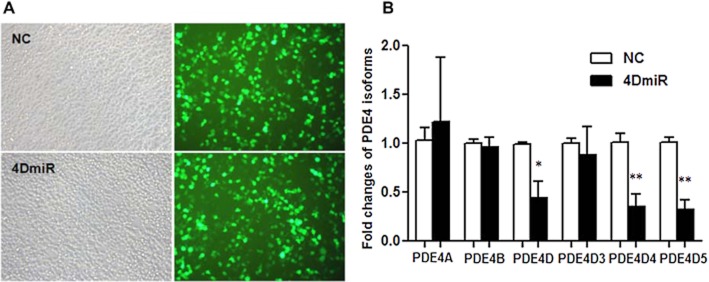
Figure 2.

Effects of lenti-PDE4D-shRNA on expression of PDE4 isoforms and variants in transfected HEK293 cells measured by quantitative real-time PCR. (A) 4DmiR and NC were well expressed in HEK293 cells as indicated by EGFP (green) observed under a fluorescence microscope. Scale bar = 100 μm. (B) The values of densitometric analysis were calculated by the 2−ΔΔCT method and normalized by the level of GAPDH. The mean ± SEM of three independent experiments is shown; *P < 0.05, **P < 0.01 versus corresponding NC.
