Figure 3.
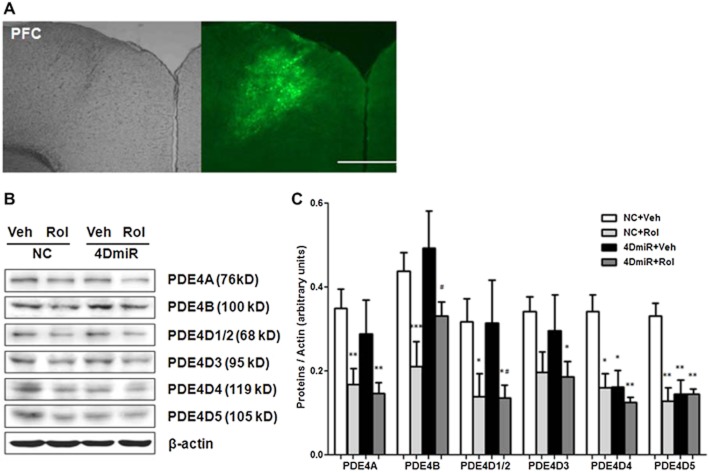
Effects of 4DmiR and/or rolipram (1.25 mg·kg−1) on expression of PDE4 isoforms and variants in the PFC of mice. (A) Microinjection sites (left panels) and high, specific expressions of EGFP (green; right panels) in the PFC observed under fluorescence microscopy. Scale bars = 500 μm. (B) Representative immunoblots of PDE4 isoforms and variants. The prefrontal cortical tissues of 3 mm in diameter around the injection site were punched out for Western-blotting analysis. (C) The histogram represents semi-quantitative results of Western-blotting analysis. The values of densitometric analysis were normalized by the level of β-actin. Values shown are means ± SEM; n = 4–5; *P < 0.05, **P < 0.01, ***P < 0.001 versus the corresponding controls (NC + Veh); #P < 0.05 versus NC + 4DmiR.

