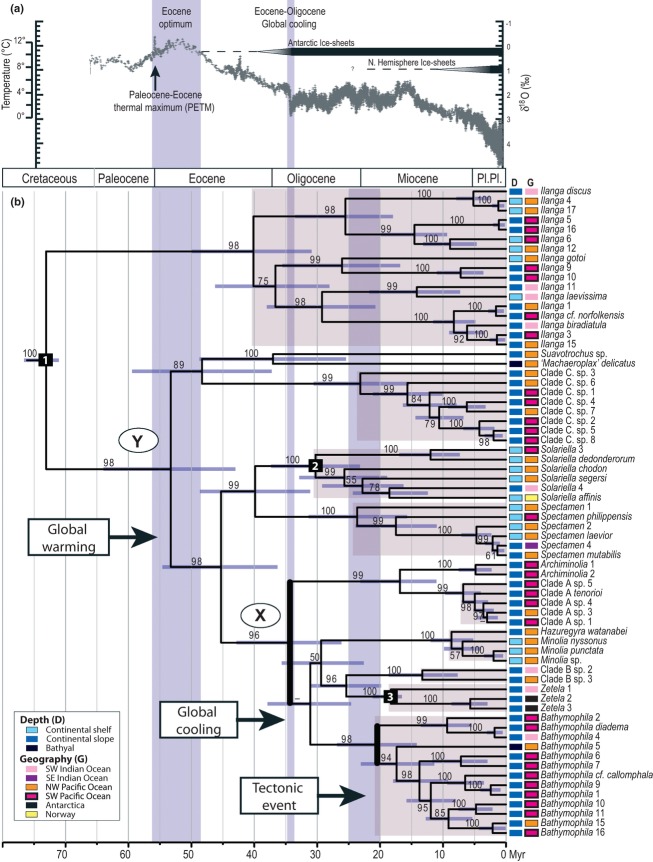
Figure 4.
(a) Evolution of global climate over the last 65 Myr. The graph shows a stacked deep-sea benthic foraminiferal oxygen-isotope curve. The δ18O temperature scale, on the right axis, applies only to the time preceding the onset of large-scale glaciation on Antarctica (about 35 million years ago). Modified from Figure 2 in Zachos et al. 2008. (b) Chronogram for Solariellidae, with branch lengths proportional to time (scale below in millions of years) based on the three-calibration *BEAST tree. Support values are posterior probabilities (PP, above branches); only values ≥50% are shown. Horizontal, light purple bars on nodes correspond to 95% highest posterior density (HPD) interval for node heights (ages). The 95% HPD is the shortest interval that contains 95% of the sampled values. Clades marked X and Y are discussed in the text. Wide vertical purple bars highlight time periods of interest. Clades with substantially increased rates of diversification are indicated with thickened, vertical black lines. Geographic and depth distributions of species are indicated by a colored box next to the species name (see Key for details). Nodes used to calibrate chronogram are marked with a black square: 1) ingroup calibration; 2) Solariella calibration; and 3) Zetela calibration.

