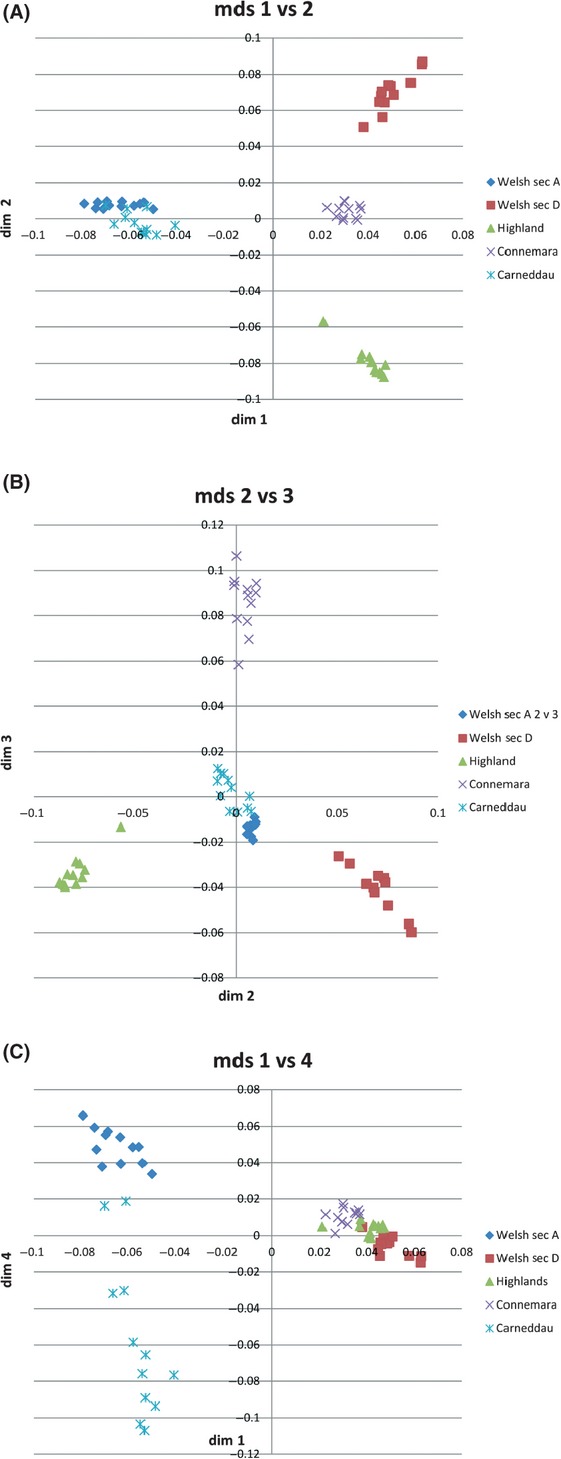
Figure 4.

A–C. Identity by State similarity scores were calculated in PLINK from 48,721 diallelic markers. The resultant similarity between individuals was subjected to classical metric multidimensional scaling and the first four most significant dimensions extracted and used to plot the three graphs shown above. Dimension 1 splits Section A/Carneddau from the rest, Dimension 2 seperates Section D and Highlands from the rest, Dimension 3 seperates Connemaras from the rest and Dimension 4 seperates Carneddau and to a lesser extent Section A from the rest.
