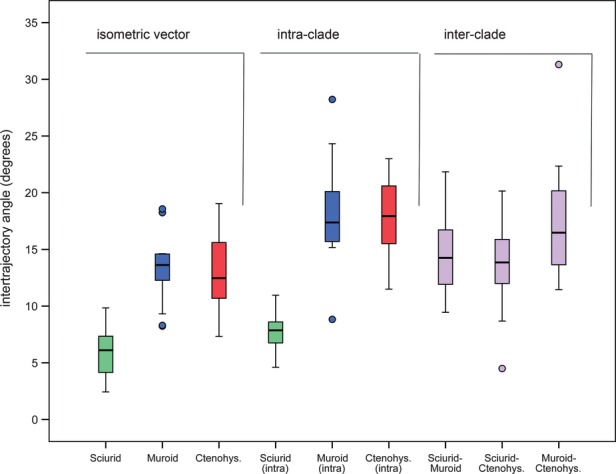
Figure 3.

Boxplots showing the distribution of inter-trajectory angle comparisons (whiskers = minima and maxima excluding outliers, filled circles = outliers, filled horizontal bar = median value, boxes = middle two quartiles). Comparisons, from left to right, are between members of a clade and the isometric vector (coefficient value of 0.2425), within members of a clade, and between members of different clades. Clades and comparisons are denoted on the x-axis (Ctenohys. = Ctenohystrica).
