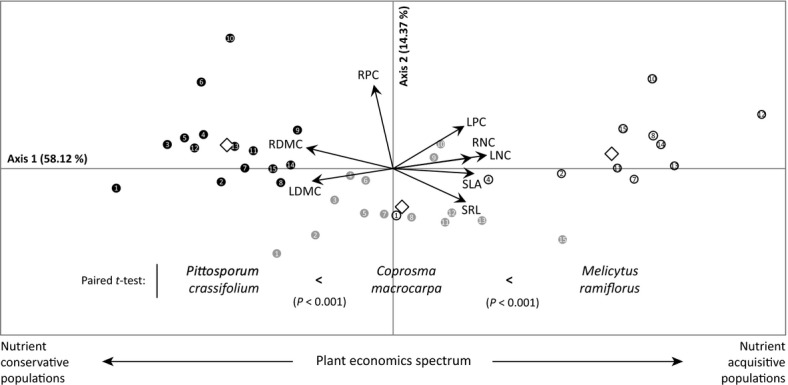
Figure 2.

Principal component analysis (PCA) on eight leaf and root traits representative of plant nutrient and carbon economics for all tree populations (15 plots × 3 species). Plot numbers are indicated for each population of Pittosporum crassifolium (•), Coprosma macrocarpa ( ), and Melicytus ramiflorus (○). The x-axis, summarizing 58% of total trait variation, ordinates tree populations from those showing the most resource-conservative traits (left) to those displaying the most resource-acquisitive ones (right). Results of paired-samples t-tests between the x-axis scores of Coprosma and Pittosporum and Coprosma and Melicytus show consistent rankings of the three tree species across all plots. Species centroids are displayed as diamonds. Plant traits: specific leaf area (SLA), specific root length (SRL), leaf and root dry matter content (LDMC, RDMC), leaf and root nitrogen (LNC, RNC) and phosphorus concentrations (LPC, RPC).
