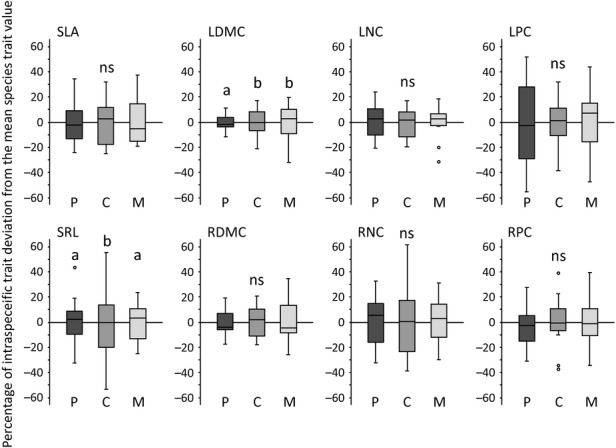
Figure 3.

Percentage deviation of Pittosporum crassifolium (P), Coprosma macrocarpa (C), and Melicytus ramiflorus (M) tree populations from their respective mean species trait value, for eight above- and belowground traits. Species are ranked from left to right from the most conservative to the most acquisitive. Each boxplot represents the intraspecific trait variation of a group of 12–15 tree populations (i.e. plots) depending on species, where population trait values are expressed as percentage deviation from the mean species trait value across all populations (central line is median; mean is zero; boxes indicate the first and third quartiles; whiskers are confidence limits; empty circles are outliers). Significant (P < 0.05; as indicated by different letters) and non-significant (ns) heterogeneity in intraspecific trait variance were tested using two-sample Fisher's F-tests on all pairs of species for each trait. Plant traits: specific leaf area (SLA), specific root length (SRL), leaf and root dry matter content (LDMC, RDMC), leaf and root nitrogen (LNC, RNC) and phosphorus concentrations (LPC, RPC).
