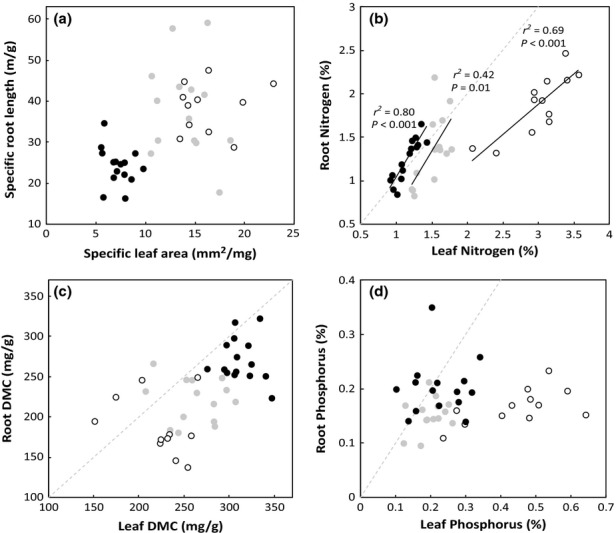
Figure 4.

Standardized major axis (SMA) regressions between analogous leaf and root functional traits across tree populations exposed to varying environmental conditions, with points representing individual plots. Tree species are Pittosporum crassifolium (•), Coprosma macrocarpa ( ), and Melicytus ramiflorus (○). Significant relationships (P < 0.05) between leaf and fine roots of the same species are indicated by their SMA regression lines, r2, and P-values. Dotted lines represent 1:1 relationships.
