
Figure 2.
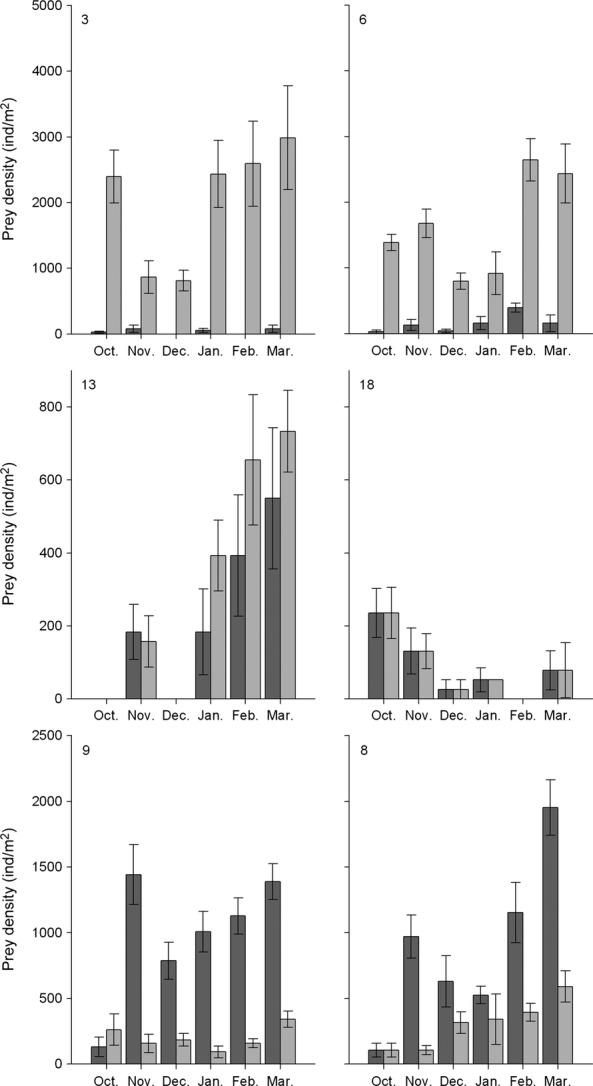
Densities (mean ± SE ind./m2) of Scrobicularia plana (dark gray bars) and Hediste diversicolor (light gray bars) at six godwit foraging locations on the Tagus estuary during each month of the winter 2006–2007. Site location is given by number (see Fig. 1 for location and Table 1 for flock diet composition of each site). Panels are displayed from top to bottom according to Hediste diversicolor density.