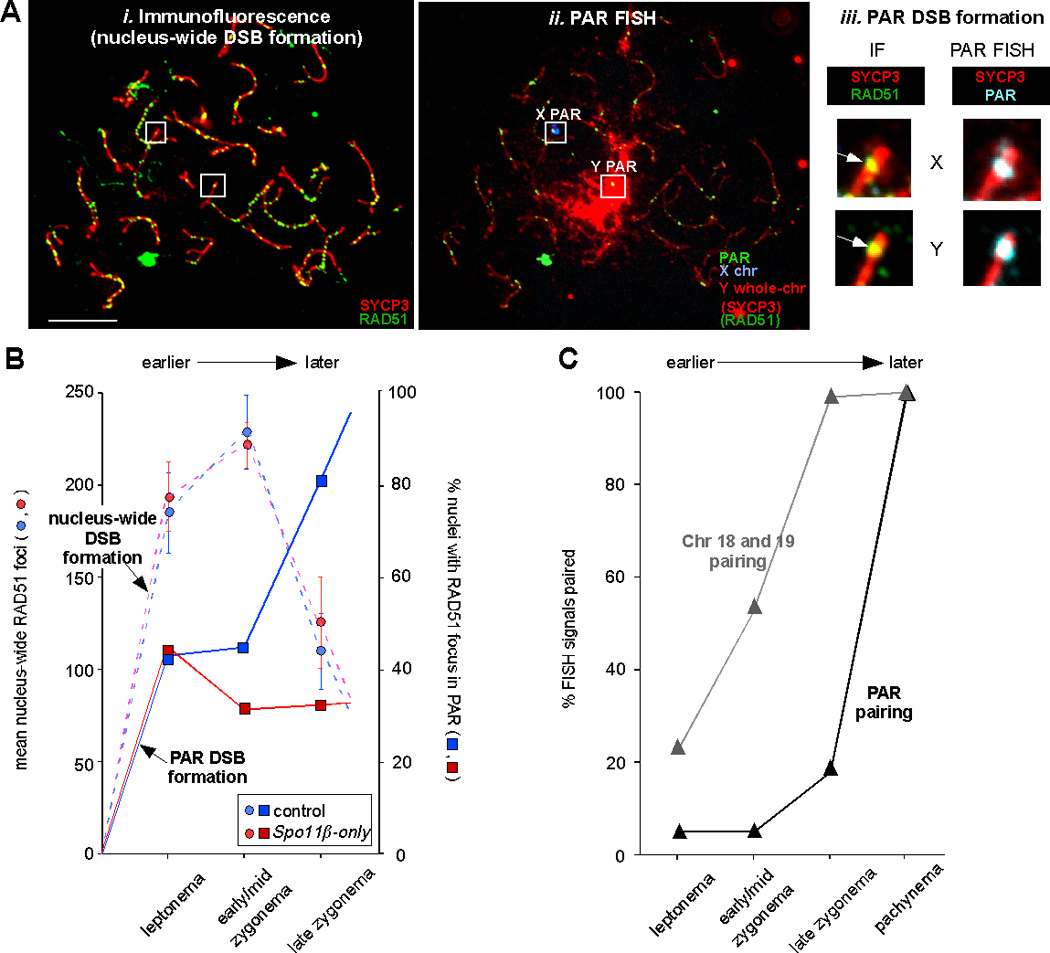
Figure 2.

Many PAR DSBs form later than nucleus-wide DSBs, and are under different genetic control. A) Assay for nucleus-wide and PAR DSB formation. i-ii) Example of immunofluorescent (IF) and FISH staining of a spermatocyte in late zygonema. Nuclei were first stained with antibodies against RAD51 and SYCP3 and photographed (i), then FISH was performed using PAR, X and Y probes (as cartooned above the FISH image) and the same nuclei were photographed again (ii).4 Under the FISH conditions used in these experiments, some IF signal remains visible. The presence or absence of a RAD51 focus in the X and Y PAR was scored by comparing the IF image to an IF+FISH image overlay (iii). In this example, both the X and Y PAR (inside white squares in i-ii) display a RAD51 focus (white arrows in iii). Scale bar, 10 µm. B) Mean nucleus-wide RAD51 focus numbers (bars ± 95% confidence interval of the mean; left Y axis) and percentage of nuclei with a PAR RAD51 focus on the X and/or Y PAR (right Y axis) as prophase I progresses from leptonema to late zygonema, in mice of the indicated genotypes (see text). C) Percentage of nuclei with paired FISH signals for autosomal and PAR probes as prophase I progresses from leptonema to pachynema.
