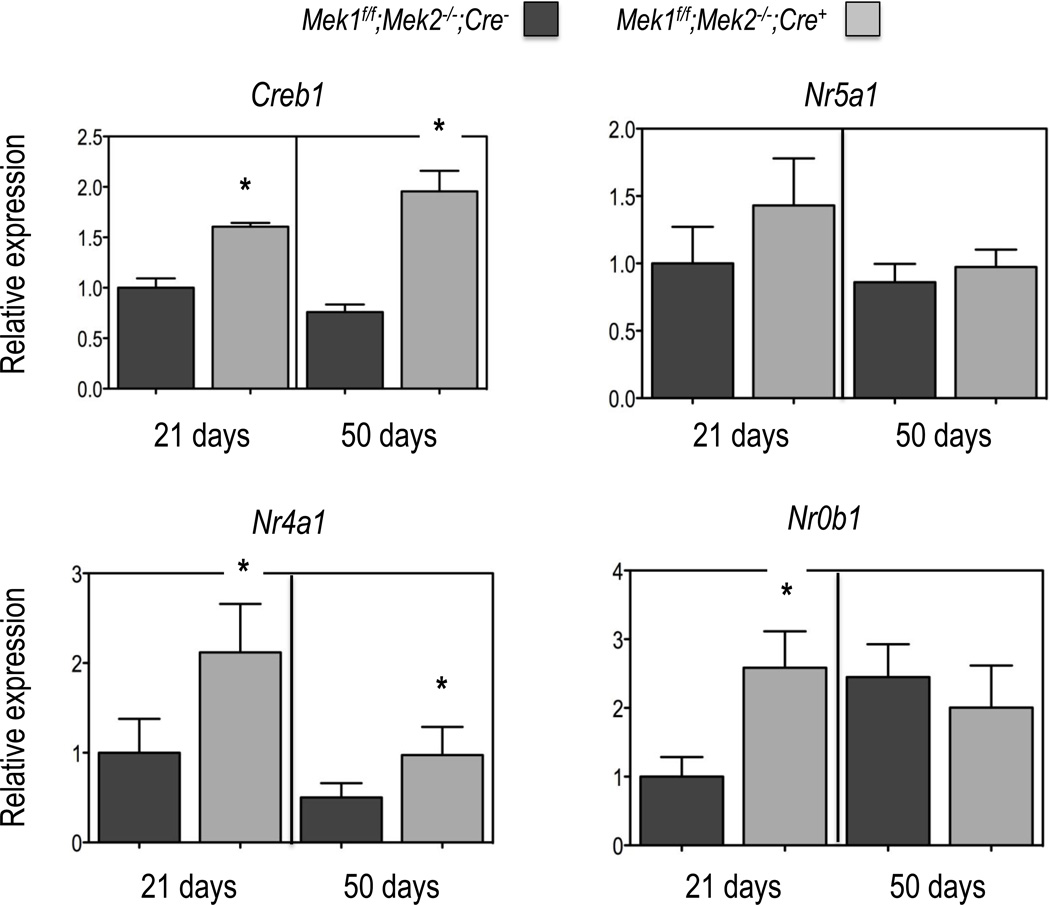
Figure 3. Expression of selected transcription factors in Leydig cells of Mek1f/f;Mek2−/−;Cre− and Mek1f/f;Mek2−/−;Cre+ mice.
Gene expression was measured by real time PCR using equal amounts of RNA isolated from freshly purified Leydig cells (see Figure 1) obtained from the testes of individual mice of the indicated genotype and age as detailed in Materials and Methods. All data are corrected for the expression of Gapdh and expressed relative to the expression of the indicated genes in the Leydig cells of the 21 day old Mek1f/f;Mek2−/−;Cre− mice. Results are the mean ± SEM of at least 5 mice. Asterisks indicate statistically different results (p < 0.05) between the two genotypes of age-matched mice.

