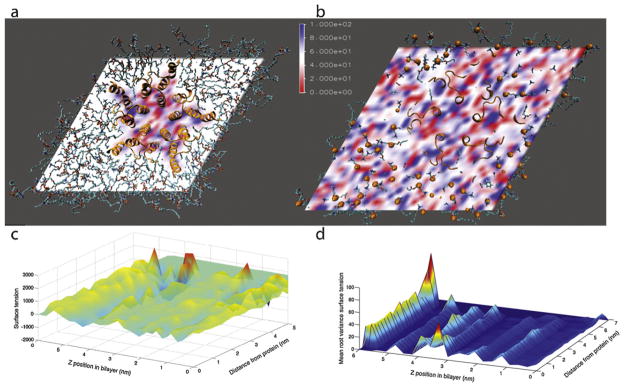
Fig. 3.

Differential pressure in a POPC bilayer containing the GLIC ion channel transmembrane region. Spatially-resolved differential pressure is rendered for a midplane slice through the bilayer (a) and a slice through the phosphate layer (b). Phospholipids are rendered in stick form, while the protein is shown in ribbon form. In (b), phosphorus atoms are shown as orange spheres. The differential pressure is plotted in (c) as a function of z-position in the bilayer and radial distance from the nearest protein atom. The mean root variance of pressure is shown in (d). (For interpretation of the references to color in this figure legend, the reader is referred to the web version of the article.)
